10:15 a.m. New York time
What’s happening now? The S&P 500 E-mini futures reached a peak of 3226.25 at 1:37 p.m. New York time on Monday, then began a rapid decline a low of 3140.50 two hours later, a decline of 2.7%. It has continued to decline this morning.
What does it mean? It appears that the upward drive from Sunday afternoon was a last effort in the upward correction that began on June 15. I’ve marked the peak with a blue line, since any resumption of the rise to beyond that level would change my interpretation of the chart. It will take a drop below the beginning of the rise, from 2923.75, to confirm that the correction has ended.
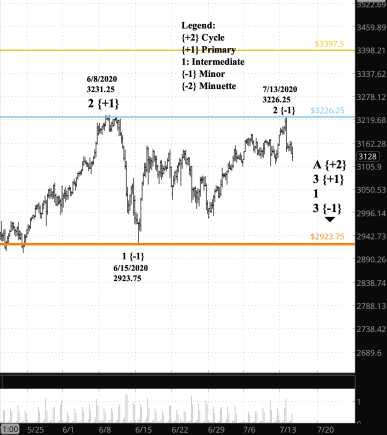
What does Elliott wave theory say? The present decline appears to be the early stages of Minor wave 3 to the downside. Each time I’ve thought that, the price has reversed and move to a higher high, showing Minor wave 2 was still underway. Minor wave 3 will be confirmed when the price drops below the end of Minor wave 1, which is 2923.75 (the red line). That’s about 200 points away. Nonetheless, I have changed the labeling to reflect the Minor wave 3 hypothesis.
What is the alternative? A move above 3226.25, the Minor wave 2 high, would mean the Minor 2 is still underway. However, there is only 5 points of upside remaining to the Minor wave 2 correction. If it were to cross 3231.25, then under the rules of Elliott wave analysis it would mean that Primary wave 2, which began March 23, is still underway. I don’t consider it to be likely, but unlikely isn’t the same as impossible.
What about my trades? Still holding off on options until Intermediate wave 3 to the downside.
Learning and other resources. Elliott Wave International has long been the leading analytical house based on Elliott wave theory. They make available a number of free educational materials and other resources, in addition to their for-pay subscriptions.
I recommend two books, both by people associated with EWI.
First, Elliott Wave Principle by Robert Prechter and A.J. Frost is the book that, along with Prechter’s analyses, that created the revival of Elliott wave theory. I first read it in 1984, and it has had a profound influenced on my thinking about markets ever since.
Second, I’ve found Visual Guide to Elliott Wave Trading by Wayne Gorman and Jeffrey Kennedy, both of EWI, to be a useful book that relates Elliott wave theory to practical trading. The authors are hands-on Elliotticians, and for an active trader, that’s exactly what’s needed — less theory and more how-to. The first chapter of the book gives a very nice thumbnail run down of what Elliott wave theory is all about.
Terminology. Here are some links to information about some of the technical jargon I use.
Charts. On my charts, waves have a subscript showing the degree above or below the Intermediate degree. Here are the subscripts and the degree each represents:
- {+3} Supercycle
- {+2} Cycle
- {+1} Primary
- No subscript: Intermediate
- {-1} Minor
- {-2} Minute
- {-3} Minuette
By Tim Bovee, Portland, Oregon, July 14, 2020
Disclaimer
Tim Bovee, Private Trader tracks the analysis and trades of a private trader for his own accounts. Nothing in this blog constitutes a recommendation to buy or sell stocks, options or any other financial instrument. The only purpose of this blog is to provide education and entertainment.
No trader is ever 100 percent successful in his or her trades. Trading in the stock and option markets is risky and uncertain. Each trader must make trading decisions for his or her own account, and take responsibility for the consequences.
License

All content on Tim Bovee, Private Trader by Timothy K. Bovee is licensed under a Creative Commons Attribution-ShareAlike 4.0 International License.
Based on a work at www.timbovee.com.

You must be logged in to post a comment.