10:25 a.m. New York time
What’s happening now? The S&P 500 index rose to the upper boundary of the price channel in the second — and last — upward correction of the decline that began September 2. The high so far is 3351.92.
What does it mean? Once the correction is complete, the next move will be to a downside, with the price reaching into the 3100s.
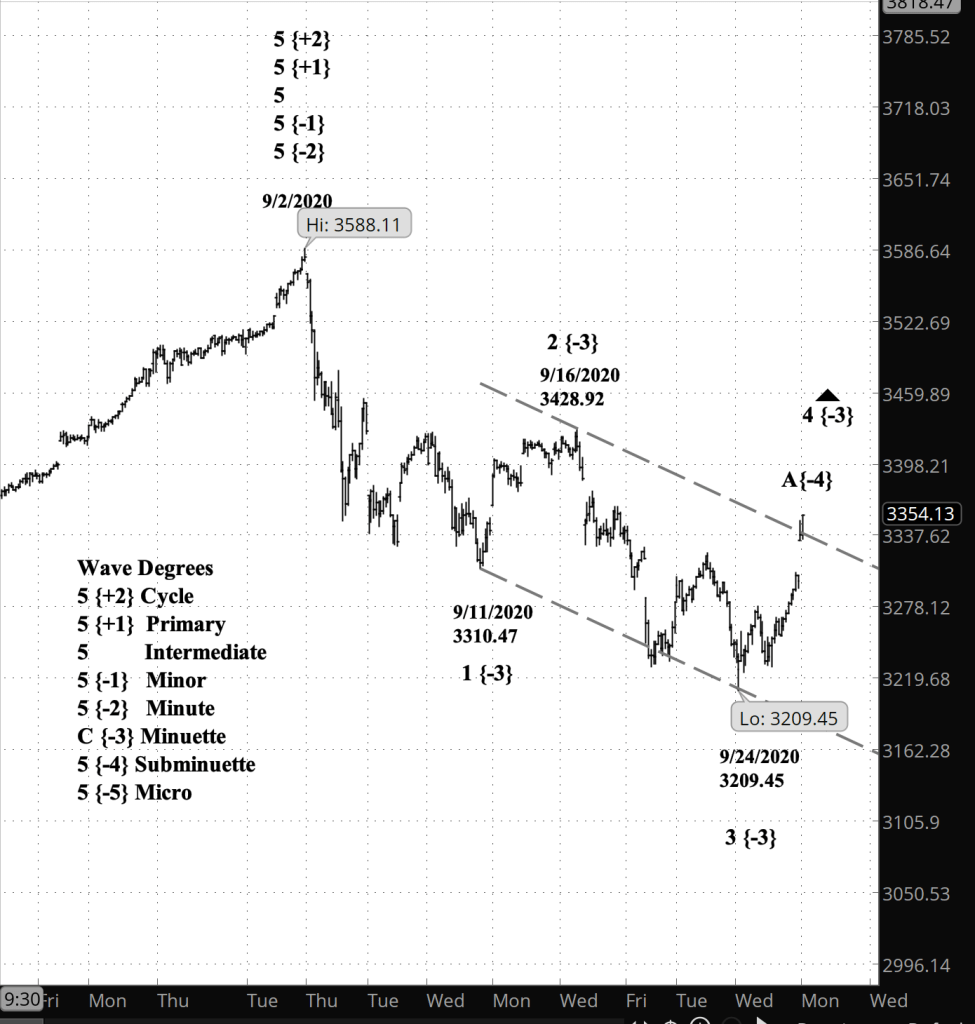
What does Elliott wave theory say? The rise that began September 24, from 3209.45, is Subminuette wave A within Minuette wave 4 within Minute wave 1. The rise to the channel’s upper boundary has come in three waves, the pattern within the A wave of a Flat pattern. That accords with Elliott wave theory, which says that waves two and four tend to be different patters. Minuette wave 2 was a Zigzag, with five waves within Subminuette wave A, and Minuette wave 4 is looking like a Flat.
My trading strategy. I’m looking at IWM as my next options play, since it has a higher implied volatility rank than SPY does. Their Elliott wave counts are the same. I’ll enter once Minuette wave 4 is complete and wave 5 of that degree has begun. I’m continuing to hold my bear-profitable shares in SDS.
Learning and other resources. Elliott Wave International has long been the leading analytical house based on Elliott wave theory. They make available a number of free educational materials and other resources, in addition to their for-pay subscriptions.
I recommend two books, both by people associated with EWI.
First, Elliott Wave Principle by Robert Prechter and A.J. Frost is the book that, along with Prechter’s analyses, that created the revival of Elliott wave theory. I first read it in 1984, and it has had a profound influenced on my thinking about markets ever since.
Second, I’ve found Visual Guide to Elliott Wave Trading by Wayne Gorman and Jeffrey Kennedy, both of EWI, to be a useful book that relates Elliott wave theory to practical trading. The authors are hands-on Elliotticians, and for an active trader, that’s exactly what’s needed — less theory and more how-to. The first chapter of the book gives a very nice thumbnail run down of what Elliott wave theory is all about.
Terminology. Here are some links to information about some of the technical jargon I use.
Charts. On my charts, waves have a subscript showing the degree above or below the Intermediate degree. Here are the subscripts and the degree each represents:
- {+3} Supercycle
- {+2} Cycle
- {+1} Primary
- No subscript: Intermediate
- {-1} Minor
- {-2} Minute
- {-3} Minuette
By Tim Bovee, Portland, Oregon, September 28, 2020
Disclaimer
Tim Bovee, Private Trader tracks the analysis and trades of a private trader for his own accounts. Nothing in this blog constitutes a recommendation to buy or sell stocks, options or any other financial instrument. The only purpose of this blog is to provide education and entertainment.
No trader is ever 100 percent successful in his or her trades. Trading in the stock and option markets is risky and uncertain. Each trader must make trading decisions for his or her own account, and take responsibility for the consequences.
License
All content on Tim Bovee, Private Trader by Timothy K. Bovee is licensed under a Creative Commons Attribution-ShareAlike 4.0 International License.
Based on a work at www.timbovee.com.

You must be logged in to post a comment.