1:10 p.m. New York time
Note: At the opening bell I was away from my trading desk for an early morning appointment. Upon my return, I have updated the analysis and chart based on the S&P 500 index.
What’s happening now? The S&P 500 index reversed in overnight trading and broke above the upper boundary of the price channel, likely marking the start of a downward movement within an upward correction that began on September 24.
What does it mean? The downward correction within a larger scale uptrending correction means that there is another upward movement, perhaps to a higher level, to be expected in the near future.
What’s the alternative? The downward flip could be a smaller scale correction within a continuing uptrend.
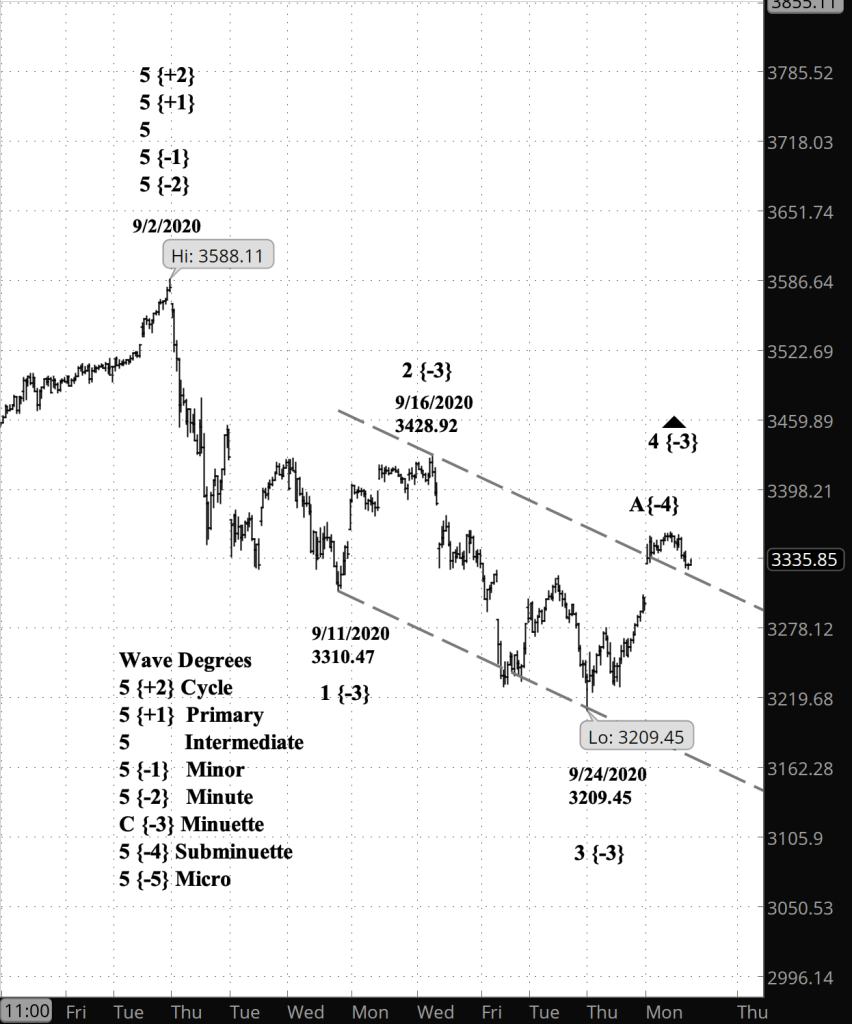
What does Elliott wave theory say? A breakout in Elliott usually denotes a turning point and, on this chart, strengthens the case that Subminuette wave A has reached an end.
The larger upward correction is wave 4 of the Minuette degree within downtrending wave 1 of the Minor degree. The downward loop could be the beginning of wave B of Subminuette degree. Alternatively, it could be a Micro-degree correction with in an ongoing Subminuette B.
My trading strategy. Unchanged. I’m waiting for a 5th wave at Subminuette degree before considering new options positions. I’m holding my bear-oriented shares of SDS.
Learning and other resources. Elliott Wave International has long been the leading analytical house based on Elliott wave theory. They make available a number of free educational materials and other resources, in addition to their for-pay subscriptions.
I recommend two books, both by people associated with EWI.
First, Elliott Wave Principle by Robert Prechter and A.J. Frost is the book that, along with Prechter’s analyses, that created the revival of Elliott wave theory. I first read it in 1984, and it has had a profound influenced on my thinking about markets ever since.
Second, I’ve found Visual Guide to Elliott Wave Trading by Wayne Gorman and Jeffrey Kennedy, both of EWI, to be a useful book that relates Elliott wave theory to practical trading. The authors are hands-on Elliotticians, and for an active trader, that’s exactly what’s needed — less theory and more how-to. The first chapter of the book gives a very nice thumbnail run down of what Elliott wave theory is all about.
Terminology. Here are some links to information about some of the technical jargon I use.
Charts. On my charts, waves have a subscript showing the degree above or below the Intermediate degree. Here are the subscripts and the degree each represents:
- {+3} Supercycle
- {+2} Cycle
- {+1} Primary
- No subscript: Intermediate
- {-1} Minor
- {-2} Minute
- {-3} Minuette
By Tim Bovee, Portland, Oregon, September 29, 2020
Disclaimer
Tim Bovee, Private Trader tracks the analysis and trades of a private trader for his own accounts. Nothing in this blog constitutes a recommendation to buy or sell stocks, options or any other financial instrument. The only purpose of this blog is to provide education and entertainment.
No trader is ever 100 percent successful in his or her trades. Trading in the stock and option markets is risky and uncertain. Each trader must make trading decisions for his or her own account, and take responsibility for the consequences.
License
All content on Tim Bovee, Private Trader by Timothy K. Bovee is licensed under a Creative Commons Attribution-ShareAlike 4.0 International License.
Based on a work at www.timbovee.com.

You must be logged in to post a comment.