3:40 p.m. New York time
The S&P 500 index peaked at 3393.56 and reversed to the downside, potentially completing wave A of Subminuette degree to the upside and beginning the Subminuette B decline. We’ll see what happens overnight.
10:25 a.m. New York time
What’s happening now? The S&P 500 index has continued to rise in an upward correction within a larger-scale downtrend, remaining above the upper boundary of the price channel. The high so far is 3373.41.
What does it mean? My alternative count of yesterday turns out to be where the index is going. The move above the channel continues to suggest that the present rise is nearing its end.
What is the alternative? Yesterday’s principle count becomes today’s alternative: Today’s high could mark the end of the upward correction.
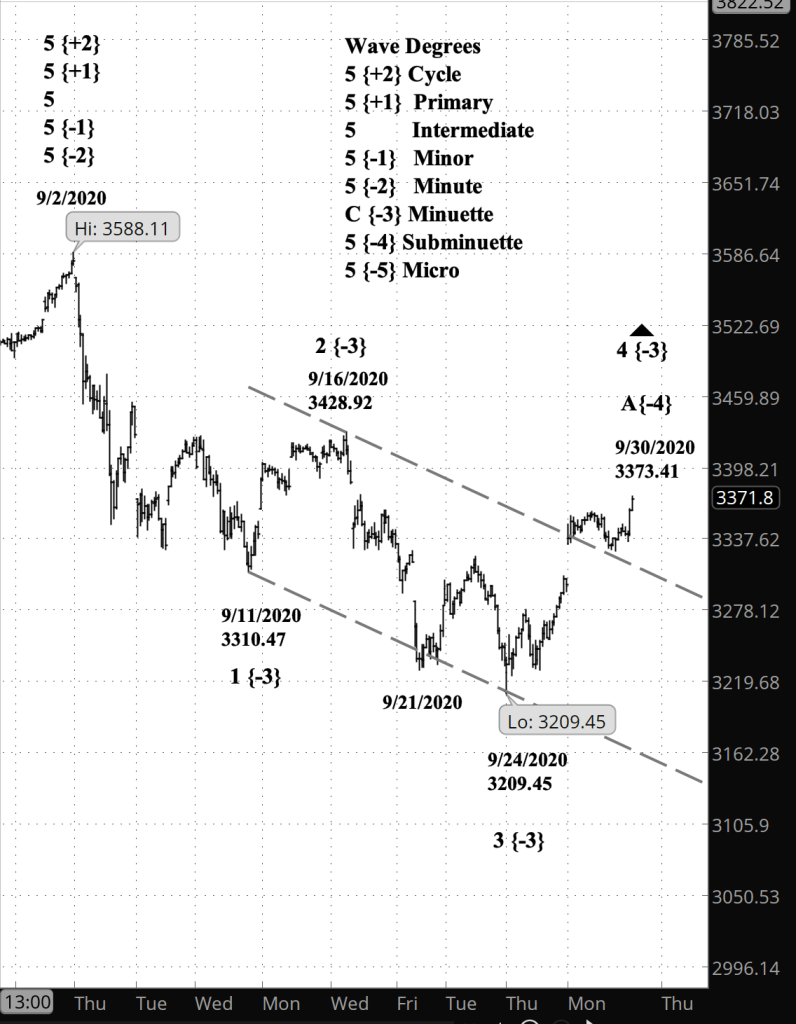
What does Elliott wave theory say? The rise since September 24, from 3,209.45, is wave A of Subminuette degree within wave 4 of the Minute degree, which is within wave 1 of the minute degree.
Internally, wave A now breaks into five subwaves of the Micro degree, with today’s rise being the 5th wave. The five-wave breakdown of wave A means that the parent wave 4 correction is tracing out a Zigzag pattern, a Combination, or a Triangle. If it were a Flat, then wave A would have broken down into three subwaves.
My trading strategy. A combination or a triangle will stretch out the time wave 4 will take to do its work, and that will make it difficult to catch the current entry window for an options position, which began yesterday and ends October 13. I’ll continue to hold my shares of SDS, which gain value as the S&P 500 loses value.
Learning and other resources. Elliott Wave International has long been the leading analytical house based on Elliott wave theory. They make available a number of free educational materials and other resources, in addition to their for-pay subscriptions.
I recommend two books, both by people associated with EWI.
First, Elliott Wave Principle by Robert Prechter and A.J. Frost is the book that, along with Prechter’s analyses, that created the revival of Elliott wave theory. I first read it in 1984, and it has had a profound influenced on my thinking about markets ever since.
Second, I’ve found Visual Guide to Elliott Wave Trading by Wayne Gorman and Jeffrey Kennedy, both of EWI, to be a useful book that relates Elliott wave theory to practical trading. The authors are hands-on Elliotticians, and for an active trader, that’s exactly what’s needed — less theory and more how-to. The first chapter of the book gives a very nice thumbnail run down of what Elliott wave theory is all about.
Terminology. Here are some links to information about some of the technical jargon I use.
Charts. On my charts, waves have a subscript showing the degree above or below the Intermediate degree. Here are the subscripts and the degree each represents:
- {+3} Supercycle
- {+2} Cycle
- {+1} Primary
- No subscript: Intermediate
- {-1} Minor
- {-2} Minute
- {-3} Minuette
By Tim Bovee, Portland, Oregon, September 30, 2020
Disclaimer
Tim Bovee, Private Trader tracks the analysis and trades of a private trader for his own accounts. Nothing in this blog constitutes a recommendation to buy or sell stocks, options or any other financial instrument. The only purpose of this blog is to provide education and entertainment.
No trader is ever 100 percent successful in his or her trades. Trading in the stock and option markets is risky and uncertain. Each trader must make trading decisions for his or her own account, and take responsibility for the consequences.
License
All content on Tim Bovee, Private Trader by Timothy K. Bovee is licensed under a Creative Commons Attribution-ShareAlike 4.0 International License.
Based on a work at www.timbovee.com.

You must be logged in to post a comment.