10:15 a.m. New York time
What’s happening now? The S&P 500 index moved a bit higher in overnight trading, to a high so far today of 3397.18. The upward correction that began September 24 has so far covered 187.73 points, or 5.8%.
What does it mean? The correction continues to trade above the upper boundary of the price channel and has met the formal requirements of completion. However, there is nothing that stops it from rising further.
What is the alternative? The correction could also take on a more complex form. See the Elliott wave discussion, below.
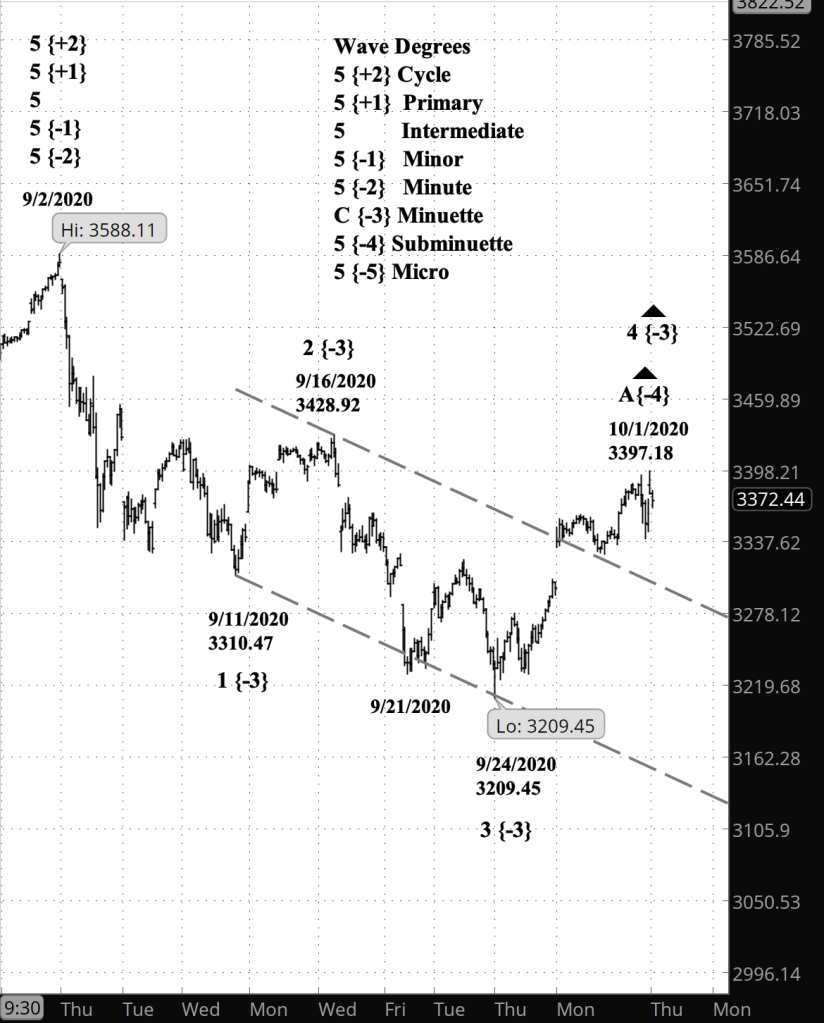
What does Elliott wave theory say? Fourth waves tend to be the most varied of the subcomponents of motive waves, and the most likely to extend into compound patterns. What we’ve seen so far with this 4th wave of Subminuette degree is a Zigzag, which in itself is unusual in that it is the same pattern as wave 4. Almost always the 2nd and 4th waves have different patterns. It’s possible that Subminuette 4 will continue with an X-wave separator, and then trace out another pattern, such as a Flat or another Zigzag. It’s also possible that what we’re seeing is a Horizontal Triangle in the making.
All of this is happening within a corrective subwave within Minuette wave 3, which in turn is a component of Minor wave 1.
My trading strategy. Given the ambiguities, I’ll be cautious about entering new options positions and will continue to hold my shares in the bearish exchange-traded fund SDS.
Learning and other resources. Elliott Wave International has long been the leading analytical house based on Elliott wave theory. They make available a number of free educational materials and other resources, in addition to their for-pay subscriptions.
I recommend two books, both by people associated with EWI.
First, Elliott Wave Principle by Robert Prechter and A.J. Frost is the book that, along with Prechter’s analyses, that created the revival of Elliott wave theory. I first read it in 1984, and it has had a profound influenced on my thinking about markets ever since.
Second, I’ve found Visual Guide to Elliott Wave Trading by Wayne Gorman and Jeffrey Kennedy, both of EWI, to be a useful book that relates Elliott wave theory to practical trading. The authors are hands-on Elliotticians, and for an active trader, that’s exactly what’s needed — less theory and more how-to. The first chapter of the book gives a very nice thumbnail run down of what Elliott wave theory is all about.
Terminology. Here are some links to information about some of the technical jargon I use.
Charts. On my charts, waves have a subscript showing the degree above or below the Intermediate degree. Here are the subscripts and the degree each represents:
- {+3} Supercycle
- {+2} Cycle
- {+1} Primary
- No subscript: Intermediate
- {-1} Minor
- {-2} Minute
- {-3} Minuette
By Tim Bovee, Portland, Oregon, October 1, 2020
Disclaimer
Tim Bovee, Private Trader tracks the analysis and trades of a private trader for his own accounts. Nothing in this blog constitutes a recommendation to buy or sell stocks, options or any other financial instrument. The only purpose of this blog is to provide education and entertainment.
No trader is ever 100 percent successful in his or her trades. Trading in the stock and option markets is risky and uncertain. Each trader must make trading decisions for his or her own account, and take responsibility for the consequences.
License
All content on Tim Bovee, Private Trader by Timothy K. Bovee is licensed under a Creative Commons Attribution-ShareAlike 4.0 International License.
Based on a work at www.timbovee.com.

You must be logged in to post a comment.