10:15 a.m. New York time, chart updated 3:15 p.m.
What’s happening now? The S&P 500 index rose to more than 25 points above Friday’s close, to a high so far of 3549.41 shortly after the opening bell.
What does it mean? The upward correction that began September 24, from 3209.45, continues, part of a larger downtrend that began in September 2 from 3588.11
What is the alternative? It’s possible that what my principle count labels as an upward correction is in fact a component of of the massive rise that began in 1974. If the price exceeds 3588.11, the the alternative count is correct. I’ve marked the 3588.11 level with a golden line on the chart.
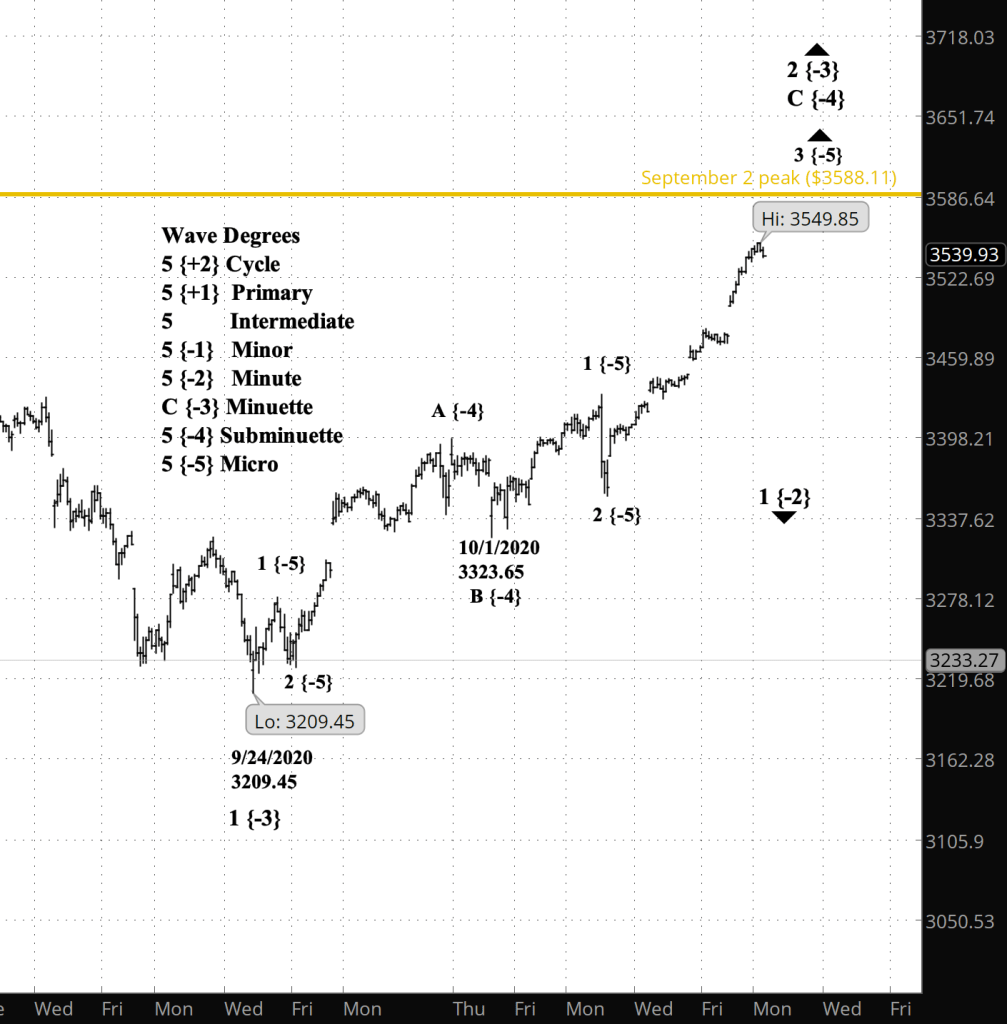
What does Elliott wave theory say? Today’s chart takes a closer look at the index, focusing on the present wave 2 of Minuette degree, that began September 24. For a broader view, see Friday’s post. Within Minuette 2, I count the present position as wave 3 of Micro degree within wave C of Subminuette degree.
I had initially counted the rise from October 1 as part of an A wave, but the price is so close to the 3588.11 limit that I’ve relabelled that position as the end of wave B and the beginning of our present wave C.
My trading strategy. Wave C will be followed by a decline, and I’m counting on that to create an exit point for my short bear call options spreads. The management day for the position is October 30, and expiration is November 20. If the price pushes above the 3588.11 limit, then I exit immediately. I shall continue to hold my bear-oriented shares of the inverse S&P 500 fund SDS.
Learning and other resources. Elliott Wave International has long been the leading analytical house based on Elliott wave theory. They make available a number of free educational materials and other resources, in addition to their for-pay subscriptions.
I recommend two books, both by people associated with EWI.
First, Elliott Wave Principle by Robert Prechter and A.J. Frost is the book that, along with Prechter’s analyses, that created the revival of Elliott wave theory. I first read it in 1984, and it has had a profound influenced on my thinking about markets ever since.
Second, I’ve found Visual Guide to Elliott Wave Trading by Wayne Gorman and Jeffrey Kennedy, both of EWI, to be a useful book that relates Elliott wave theory to practical trading. The authors are hands-on Elliotticians, and for an active trader, that’s exactly what’s needed — less theory and more how-to. The first chapter of the book gives a very nice thumbnail run down of what Elliott wave theory is all about.
Terminology. Here are some links to information about some of the technical jargon I use.
Charts. On my charts, waves have a subscript showing the degree above or below the Intermediate degree. Here are the subscripts and the degree each represents:
- {+3} Supercycle
- {+2} Cycle
- {+1} Primary
- No subscript: Intermediate
- {-1} Minor
- {-2} Minute
- {-3} Minuette
By Tim Bovee, Portland, Oregon, October 12, 2020
Disclaimer
Tim Bovee, Private Trader tracks the analysis and trades of a private trader for his own accounts. Nothing in this blog constitutes a recommendation to buy or sell stocks, options or any other financial instrument. The only purpose of this blog is to provide education and entertainment.
No trader is ever 100 percent successful in his or her trades. Trading in the stock and option markets is risky and uncertain. Each trader must make trading decisions for his or her own account, and take responsibility for the consequences.
License
All content on Tim Bovee, Private Trader by Timothy K. Bovee is licensed under a Creative Commons Attribution-ShareAlike 4.0 International License.
Based on a work at www.timbovee.com.

You must be logged in to post a comment.