10:50 a.m. New York time
What’s happening now? The S&P 500 index fell off slightly from its peak in the present upward correction, 3549.85, attained yesterday, October 12.
What does it mean? The fall is the deepest since the decline of October 6, whose end marks the beginning of the present rise, suggesting at least the possibility that the present rise is complete. However, as the Elliott wave theory section will discuss, the end of the present rise is not the end of the larger-scale rise that began September 24, and that constrains the index’s price movement in two ways: It must eventually move above 3549.85, and yet it must not move above the high set on September 2, 3588.11, the starting point of a major decline that, history suggests, could last for years.
What is the alternative? There are two: 1) I might have misinterpreted the decline from September 2 has been misinterpreted; rather than a major decline, it is a lower-level decline within the uptrend that began in 1974, or 2) I might have misinterpreted the rise since September 6; rather than an upward movement in the middle of a larger upward movement, it is instead the final portion that completes the upward movement. If 2) is the case, then 3588.11 is the end of the upward correction and the higher-level downtrend will continue its decline.
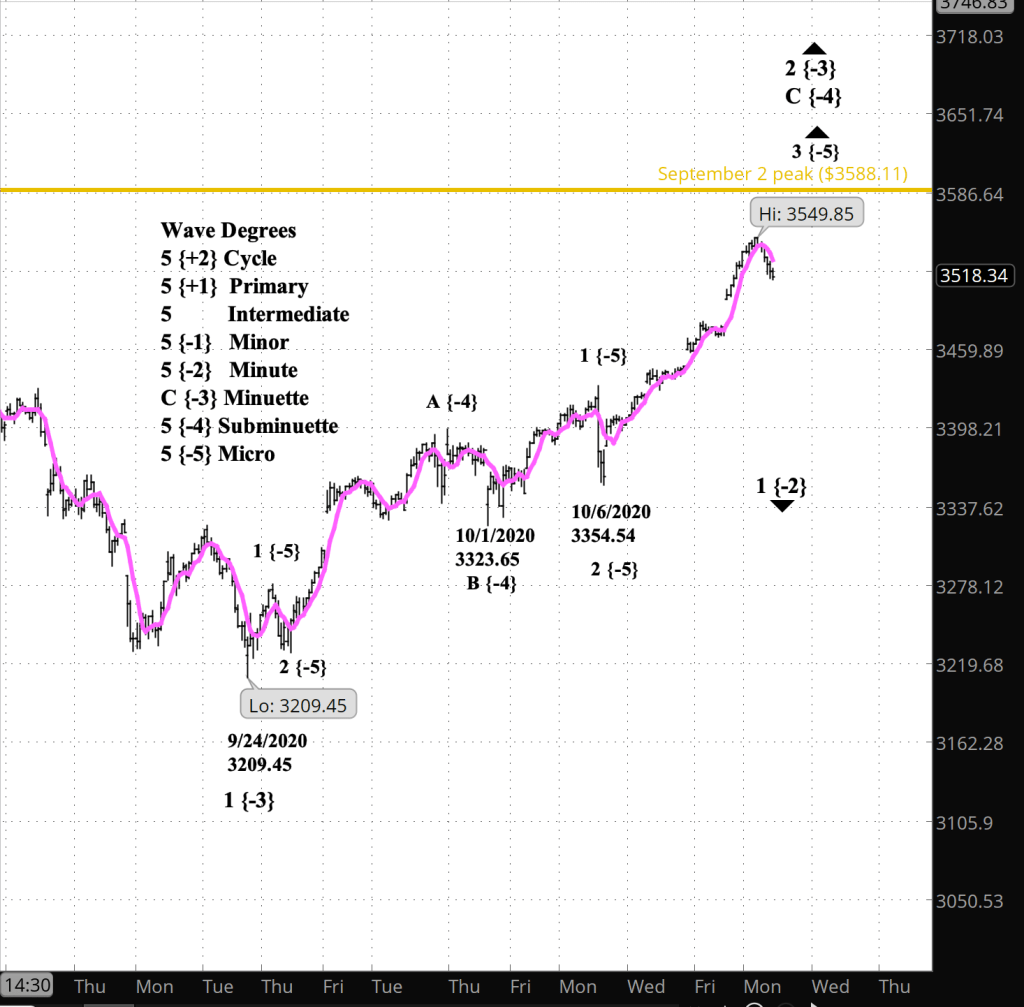
What does Elliott wave theory say? The present wave is Subminuette wave C, part of a Zigzag pattern, within Minuette wave 2, an upward correction. The entire structure is part of Minute wave 1, which began September 2 from 3588.11 and marks the end of a rise that moves at the least up to Cycle degree. The S&P 500 is presently in Cycle wave 1 to the downside. The preceding Cycle wave, 5, took 45 years to complete its work: 1974 to 2020.
Zigzag C waves have five subwaves, and by my principle count Subminuette wave C has been in Micro 3 since October 6. Once Micro 3 is complete, it triggers the constraints mentioned in the Alternative section.
By my principle count, Subminuette C of Minuette 2 must have a downward correction, or more likely, a sideways movement, and then end with a Micro 5 wave to the upside.
If Micro 5, and therefore Minuette 2, moves above the start of Minuette wave 1, which is 3588.11, it violates a fundamental rule of Elliott wave analysis: A 2nd wave cannot exceed the start of the preceding 1st wave of identical degree.
That leaves very little room for the 5th wave of Micro degree to do its work, a mere 38 points from yesterday’s peak. If yesterday’s high actually marked the end of wave 5 of Micro degree, then the price will fall and will never face the constraint.
On the chart I have superimposed a six-bar simple moving average, in garish purple, which smooths the price movements and makes the larger-degree waves more clear. I think it shows that to movement from September 24 to at least yesterday is wave 3 at the Micro level.
The other constraint is marked on the chart by a golden line at the 3588.11 level. If the price goes above that level, then the movement since September 2 has been misinterpreted and I’ll be revising my count.
My trading strategy. My bear call options spreads remain unprofitable for now but less so since the decline from yesterday’s high began. I shall hold the positions in the expectation of Subminuette wave 3 to the downside, which will restore the positions to profitability. I continue to hold my shares in the inverse fund SDS, which gains in value as the S&P 500 increases in value.
Learning and other resources. Elliott Wave International has long been the leading analytical house based on Elliott wave theory. They make available a number of free educational materials and other resources, in addition to their for-pay subscriptions.
I recommend two books, both by people associated with EWI.
First, Elliott Wave Principle by Robert Prechter and A.J. Frost is the book that, along with Prechter’s analyses, that created the revival of Elliott wave theory. I first read it in 1984, and it has had a profound influenced on my thinking about markets ever since.
Second, I’ve found Visual Guide to Elliott Wave Trading by Wayne Gorman and Jeffrey Kennedy, both of EWI, to be a useful book that relates Elliott wave theory to practical trading. The authors are hands-on Elliotticians, and for an active trader, that’s exactly what’s needed — less theory and more how-to. The first chapter of the book gives a very nice thumbnail run down of what Elliott wave theory is all about.
Terminology. Here are some links to information about some of the technical jargon I use.
Charts. On my charts, waves have a subscript showing the degree above or below the Intermediate degree. Here are the subscripts and the degree each represents:
- {+3} Supercycle
- {+2} Cycle
- {+1} Primary
- No subscript: Intermediate
- {-1} Minor
- {-2} Minute
- {-3} Minuette
By Tim Bovee, Portland, Oregon, October xx, 2020
Disclaimer
Tim Bovee, Private Trader tracks the analysis and trades of a private trader for his own accounts. Nothing in this blog constitutes a recommendation to buy or sell stocks, options or any other financial instrument. The only purpose of this blog is to provide education and entertainment.
No trader is ever 100 percent successful in his or her trades. Trading in the stock and option markets is risky and uncertain. Each trader must make trading decisions for his or her own account, and take responsibility for the consequences.
License
All content on Tim Bovee, Private Trader by Timothy K. Bovee is licensed under a Creative Commons Attribution-ShareAlike 4.0 International License.
Based on a work at www.timbovee.com.

You must be logged in to post a comment.