3:25 p.m. New York time
Regarding the decline that resumed about a half hour or so into trading. By my principal count, wave B of Minor degree is continuing its fall. Internally, it has completed waves A and B of Minute degree, and is now tracing wave C. The form of the decline is consistent not only with my principle count, but also with the two alternatives I discussed earlier today.
9:45 a.m. New York time
What’s happening now? The S&P 500 index continues its upward correction that began September 24 at 3209.45.
What does it mean? The correction will likely move above 3549.85, the highest high of the correction so far, set on October 12. Once the correction is complete, it will either extend by connecting to forms together. Otherwise, it will resume the principle down trend, moving below 3209.45, where the upward correction began.
What is the alternative? The October 12 high at 3549.85 can be analyzed as the end of the upward correction. If that is what market is doing, then the subsequent decline is either begins the resumption of the principle downtrend, or it is a connecting movement that will be followed by another corrective pattern.
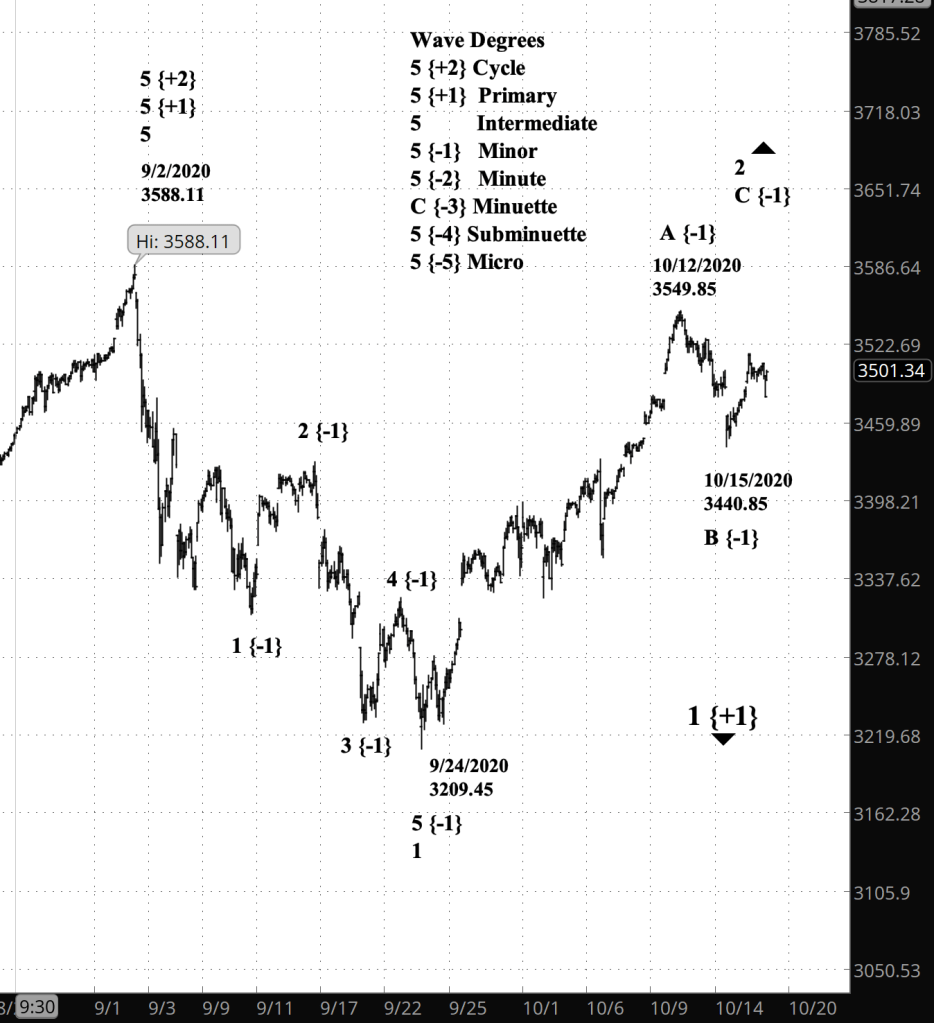
What does Elliott wave theory say? By my count, the October 12 high is the end of Minor wave A and the decline that followed is Minor wave B, all happening within Intermediate wave 2, which in turn is a subwave of Primary wave 1. Minor C, an uptrending wave within the correction, will carry the price above 3549.85.
First alternative: The peak at 3549.85 is the end of Minor wave C, and the decline is Minor wave X, a connecting wave that will lead to another corrective pattern: A Zigzag, a Flat or a Triangle.
Second alternative: The peak at 3549.85 completes Minor C and Intermediate 2, and the decline that followed is tracing the first baby steps of what will be a major decline, Intermediate wave 3.
My trading strategy. My best strategy for exiting my short bear call options spreads positions will be to Intermediate wave 3, which should be possible under two scenarios: The principle analysis and the second alternative.
The first alternative will likely take a longer amount of time, approaching the November 20 expiration, 32 days from now. That will force an exit for a loss or a smaller profit.
My shares of SDS, which make money on the downtrends, have no deadline, so I’ll continue to hold them, waiting for Primary wave 1 to near its end, and always mindful that if I hold them for a year, into next spring, I get a better tax rate on any profits. The market trend trumps taxes, always.
Learning and other resources. Elliott Wave International has long been the leading analytical house based on Elliott wave theory. They make available a number of free educational materials and other resources, in addition to their for-pay subscriptions.
I recommend two books, both by people associated with EWI.
First, Elliott Wave Principle by Robert Prechter and A.J. Frost is the book that, along with Prechter’s analyses, that created the revival of Elliott wave theory. I first read it in 1984, and it has had a profound influenced on my thinking about markets ever since.
Second, I’ve found Visual Guide to Elliott Wave Trading by Wayne Gorman and Jeffrey Kennedy, both of EWI, to be a useful book that relates Elliott wave theory to practical trading. The authors are hands-on Elliotticians, and for an active trader, that’s exactly what’s needed — less theory and more how-to. The first chapter of the book gives a very nice thumbnail run down of what Elliott wave theory is all about.
Terminology. Here are some links to information about some of the technical jargon I use.
Charts. On my charts, waves have a subscript showing the degree above or below the Intermediate degree. Here are the subscripts and the degree each represents:
- {+3} Supercycle
- {+2} Cycle
- {+1} Primary
- No subscript: Intermediate
- {-1} Minor
- {-2} Minute
- {-3} Minuette
By Tim Bovee, Portland, Oregon, October 19, 2020
Disclaimer
Tim Bovee, Private Trader tracks the analysis and trades of a private trader for his own accounts. Nothing in this blog constitutes a recommendation to buy or sell stocks, options or any other financial instrument. The only purpose of this blog is to provide education and entertainment.
No trader is ever 100 percent successful in his or her trades. Trading in the stock and option markets is risky and uncertain. Each trader must make trading decisions for his or her own account, and take responsibility for the consequences.
License
All content on Tim Bovee, Private Trader by Timothy K. Bovee is licensed under a Creative Commons Attribution-ShareAlike 4.0 International License.
Based on a work at www.timbovee.com.

You must be logged in to post a comment.