3:35 a.m. New York time
I’ve updated the map with the view within half an hour of the closing bell.
8 a.m. New York time
What’s happening now? The S&P 500 index fell to 3419.93 from the peak of September 12 and reversed to the upside.
What does it mean? My principle count interprets the rise from yesterday (October 19) as a continuation of an upward correction within a larger downtrend.
What is the alternative? One alternative counts the September 12 peak as the end of the upward correction, and the subsequent fall and then the rise that began yesterday as downward steps within the larger down trend.
A second, less likely, alternative counts the decline from September 12 as a divider in a compound correction composed of two corrective patterns, back to back, with the rise from yesterday being the first wave up of the second pattern.
The Chart. On the chart below I’ve labeled the principle count in black and the first alternative count in red. I’ve used the S&P 500 E-mini futures, which never stop trading except on weekends, in order to have a more complete picture of the relative small movements we’re examining.
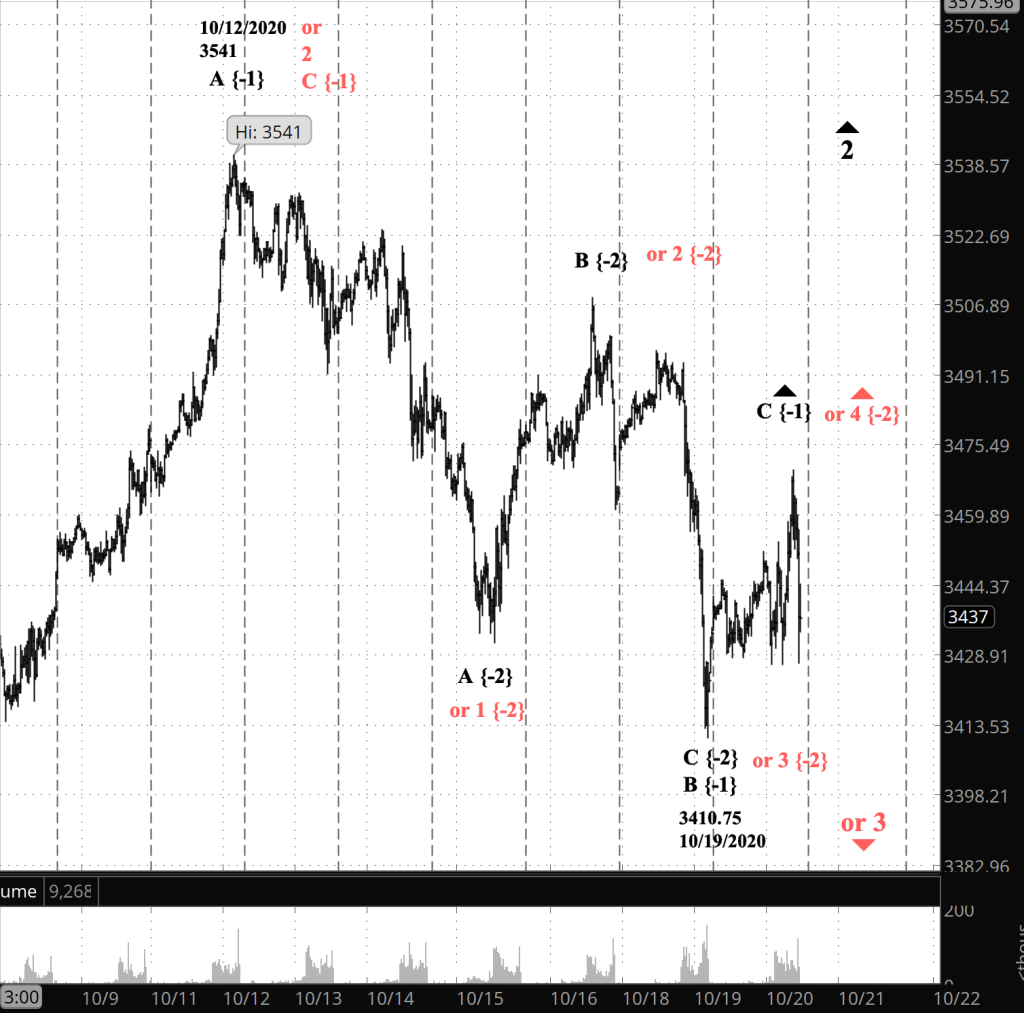
What does Elliott wave theory say? By the principle count (black on the futures chart), the fall from September 12 was Minor wave B to the downside, and the rise that began yesterday is the beginning of Minor wave C, all within the Intermediate wave 2 upward correction within Primary wave 1, which began its downward course on September 2
By the first alternative count (red on the futures chart), the peak on September 12 was the end of Intermediate wave 2 and the beginning of Intermediate 3, with yesterday’s low being the end of wave 3 of, probably, Minute degree. I say “probably” because this early in a parent wave the subwaves lack context and their degree is at best a guess.
If the principle (black) count is correct, then the present upward movement, the Minor wave C will almost certainly move beyond the end of wave A, to an extent that C will be about the same length as A, which would bring the price up to the 3700s. However, a second wave can’t move beyond the start of the preceding first wave, so 3588.11 — the September 2 high on the index chart — is as high as the Intermediate wave 2 correction and the Minor C wave within it can go. If that barrier should be breached, then the entire count from September 2 will need to be redone.
If the first alternative (red) count is correct, then Minute wave 4, an upward correction, will tend toward a sideways move, reaching a bit higher but not dramatically so. It will be followed by Minute wave 5, which will carry the price below 3209.45 on the index chart, the start of Intermediate wave 2.
My trading strategy. If the principle count is correct, then my bear call options spread positions may be in trouble. If the first alternative is correct, then I may be able to exit profitably. I’m holding my shares of SDS, the inverse fund based on the S&P 500, in the confidence that Intermediate wave 3 and its parent will eventually bring those shares to profitability.
Learning and other resources. Elliott Wave International has long been the leading analytical house based on Elliott wave theory. They make available a number of free educational materials and other resources, in addition to their for-pay subscriptions.
I recommend two books, both by people associated with EWI.
First, Elliott Wave Principle by Robert Prechter and A.J. Frost is the book that, along with Prechter’s analyses, that created the revival of Elliott wave theory. I first read it in 1984, and it has had a profound influenced on my thinking about markets ever since.
Second, I’ve found Visual Guide to Elliott Wave Trading by Wayne Gorman and Jeffrey Kennedy, both of EWI, to be a useful book that relates Elliott wave theory to practical trading. The authors are hands-on Elliotticians, and for an active trader, that’s exactly what’s needed — less theory and more how-to. The first chapter of the book gives a very nice thumbnail run down of what Elliott wave theory is all about.
Terminology. Here are some links to information about some of the technical jargon I use.
Charts. On my charts, waves have a subscript showing the degree above or below the Intermediate degree. Here are the subscripts and the degree each represents:
- {+3} Supercycle
- {+2} Cycle
- {+1} Primary
- No subscript: Intermediate
- {-1} Minor
- {-2} Minute
- {-3} Minuette
By Tim Bovee, Portland, Oregon, October 20, 2020
Disclaimer
Tim Bovee, Private Trader tracks the analysis and trades of a private trader for his own accounts. Nothing in this blog constitutes a recommendation to buy or sell stocks, options or any other financial instrument. The only purpose of this blog is to provide education and entertainment.
No trader is ever 100 percent successful in his or her trades. Trading in the stock and option markets is risky and uncertain. Each trader must make trading decisions for his or her own account, and take responsibility for the consequences.
License
All content on Tim Bovee, Private Trader by Timothy K. Bovee is licensed under a Creative Commons Attribution-ShareAlike 4.0 International License.
Based on a work at www.timbovee.com.

[…] now? The S&P 500 index continues to wind through the ambiguities I discussed in detail in yesterday’s post, climbing either as the late stage of an upward correction, or as an early stage of a resumption of […]
LikeLike