3:30 p.m. New York time
The S&P 500 has barely budged since peaking this morning after a rise that began overnight with the futures. The rise forced a reworking of my analysis See the new analysis here.
9:50 a.m. New York time
What’s happening now? The S&P 500 E-mini futures beginning Sunday rose higher above the upper boundary of the trend channel. The index on Monday opened with a price gap to the upside, reflecting the futures trading. The price moved above the high of September 2 (golden line) — 3588.11 on the index and 3587 on the futures — the beginning of what Elliott wave analysis suggested would be a significant, years-long downtrend.
What does it mean? The rise since October 30 is the first portion of a correction to the upside. It will be followed by a downward movement, and then a push to a higher level.
What is the alternative? The corrective wave’s push above the start of the major downtrend raises a signal in Elliott wave analysis that could mean that the September 2 high was not the end of the rise that began in 1974 and not the beginning of a significant downtrend. See the Elliott wave theory section, below.
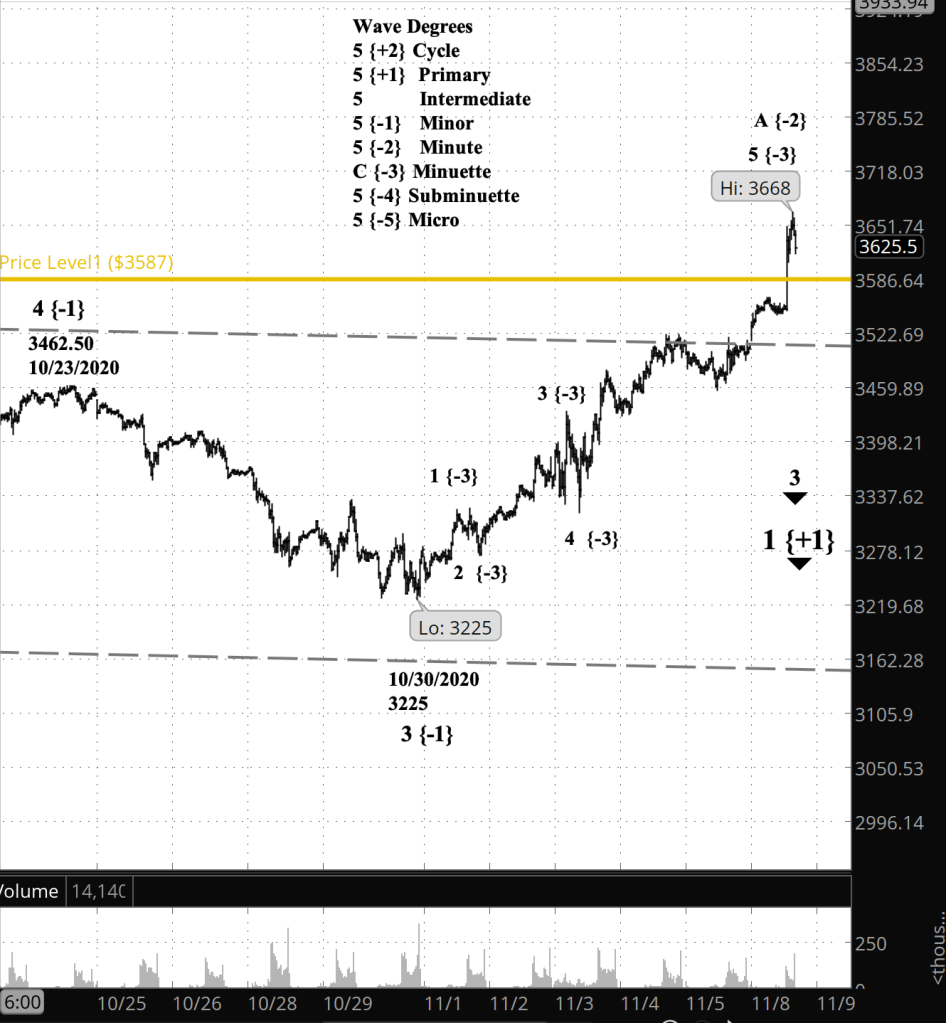
What does Elliott wave theory say? The movement of Primary wave 2 above the start of Primary wave 1 violates a rule of Elliott wave theory. If the chart shows it happening, then the count is wrong and must be redone. I don’t yet know what will replace the count shown on the chart above. I’ll post the revision after I’ve done the work and thought it through.
11:25 a.m. New York time. And I’ve completed the reanalysis. See today’s second post, “The Great Bull Market, 1974-????”.
My trading strategy. I’m hanging on to what I have and not entering into anything new.
Learning and other resources. Elliott Wave International has long been the leading analytical house based on Elliott wave theory. They make available a number of free educational materials and other resources, in addition to their for-pay subscriptions.
I recommend two books, both by people associated with EWI.
First, Elliott Wave Principle by Robert Prechter and A.J. Frost is the book that, along with Prechter’s analyses, that created the revival of Elliott wave theory. I first read it in 1984, and it has had a profound influenced on my thinking about markets ever since.
Second, I’ve found Visual Guide to Elliott Wave Trading by Wayne Gorman and Jeffrey Kennedy, both of EWI, to be a useful book that relates Elliott wave theory to practical trading. The authors are hands-on Elliotticians, and for an active trader, that’s exactly what’s needed — less theory and more how-to. The first chapter of the book gives a very nice thumbnail run down of what Elliott wave theory is all about.
Terminology. Here are some links to information about some of the technical jargon I use.
Charts. On my charts, waves have a subscript showing the degree above or below the Intermediate degree. Here are the subscripts and the degree each represents:
- {+3} Supercycle
- {+2} Cycle
- {+1} Primary
- No subscript: Intermediate
- {-1} Minor
- {-2} Minute
- {-3} Minuette
By Tim Bovee, Portland, Oregon, November 9, 2020
Disclaimer
Tim Bovee, Private Trader tracks the analysis and trades of a private trader for his own accounts. Nothing in this blog constitutes a recommendation to buy or sell stocks, options or any other financial instrument. The only purpose of this blog is to provide education and entertainment.
No trader is ever 100 percent successful in his or her trades. Trading in the stock and option markets is risky and uncertain. Each trader must make trading decisions for his or her own account, and take responsibility for the consequences.
License
All content on Tim Bovee, Private Trader by Timothy K. Bovee is licensed under a Creative Commons Attribution-ShareAlike 4.0 International License.
Based on a work at www.timbovee.com.

You must be logged in to post a comment.