November 9, 2020, 11:25 a.m. New York time
The markets gave traders a major head-fake, beginning with futures trading on Sunday and continuing today with all blue-chip indexes and funds after the opening bell.
It was the second major head-fake of the year. Both were of a magnitude that ripped my previous analysis to shreds. With this post, I shall try to sweep away remains of the old analysis and put in its place a new analysis that will show where the markets stand, in light of their rise today.
I shall use a long-term Dow Jones Industrial Average chart for the big-picture analysis, stretching back from the present to before the Great Crash of ’29.
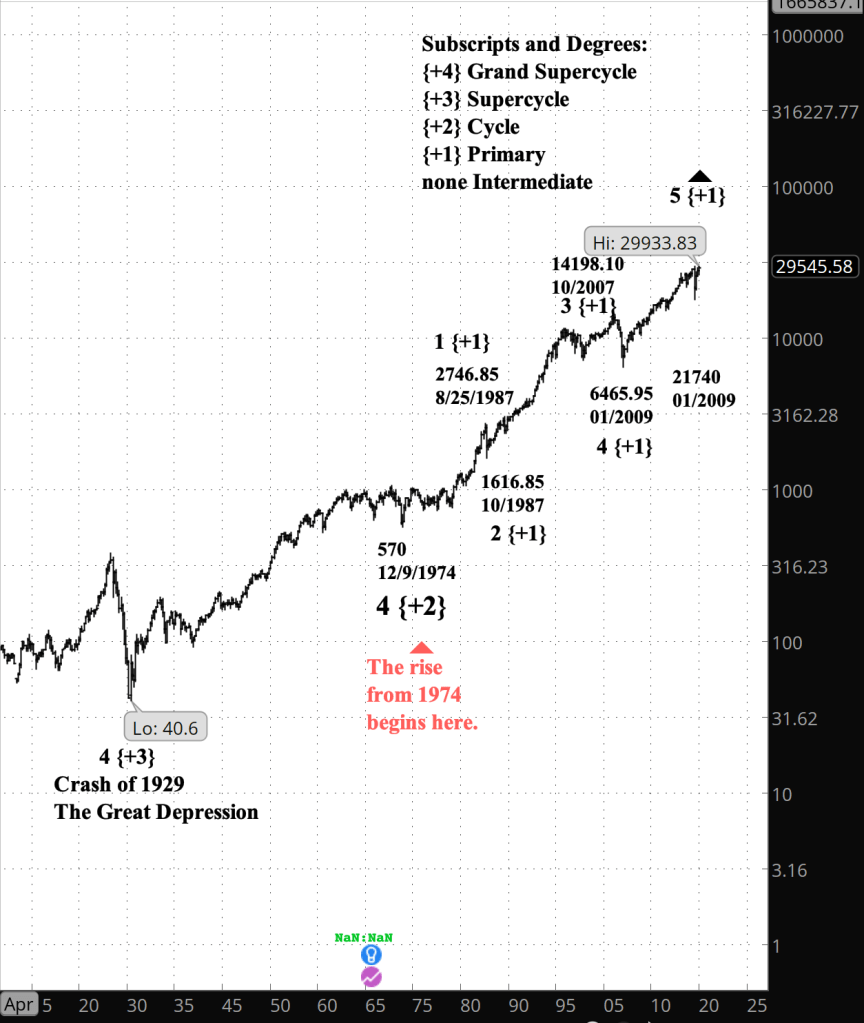
The rise from 1974 is wave 5 of Cycle degree within wave 5 of Supercycle degree, the latter having begun with the Great Crash of 1929. Cycle 5 began on December 9, 1974 at 570 on the Dow. It’s parent, Supercycle 5, began on in July 8, 1932 at 40.6. The peak so far today is 29,933.83. The markets have come a long way in the past 88 years.
Within Cycle wave 5, I count the indexes as being in wave 5 of Primary degree, which began in January at 6465.95 on the Dow. The answer to the head-fake highs this year lie within Primary wave 5.
For a closer look at Primary wave 5, I turn to a chart of the S&P 500 index.
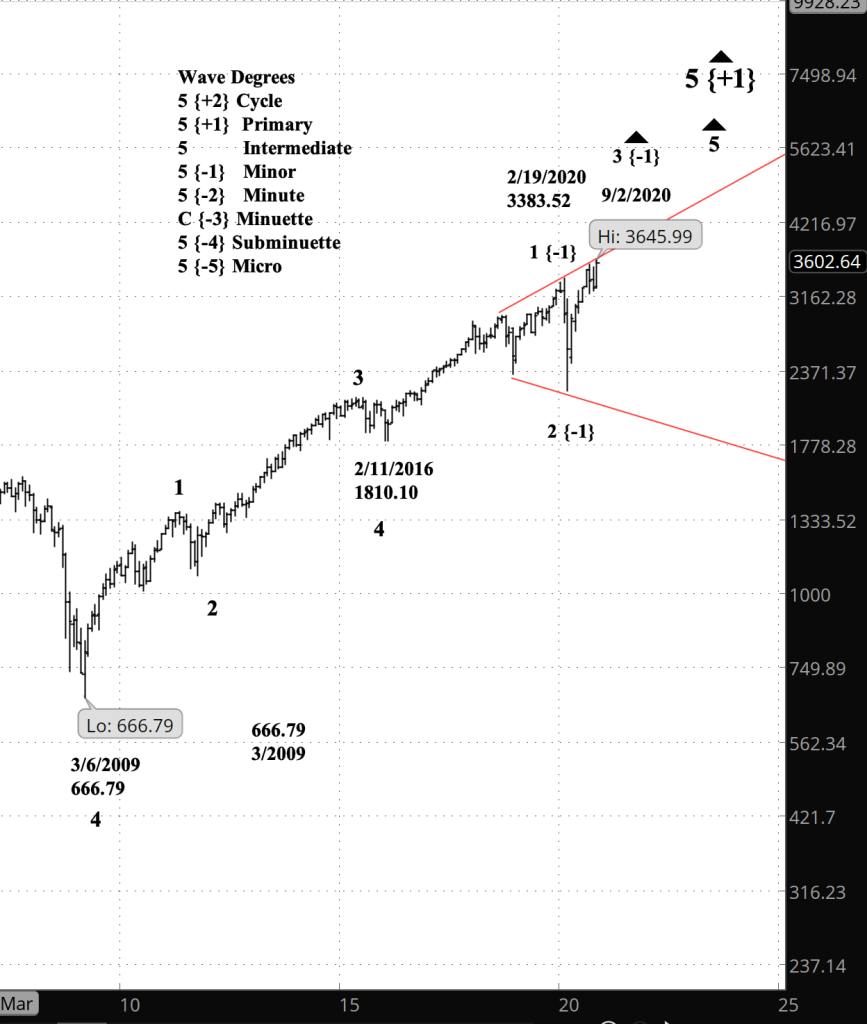
Primary wave 5 is presently in its 5th and final wave, wave 5 of Minor degree. Minor 5 as it turns out is taking the form of a Diagonal Triangle. In this case, it is an expanding version of the structure, delimited by the red lines.
Internally, a Diagonal Triangle has five waves, each built by three waves of a lower degree. By my count the Triangle is in wave 3 of Minor degree, which is rising, and it will be followed by a falling Minor 4 reaching below 2191.80, and then a rising Minor 5 that will reach a new high.
Each wave of a Diagonal Triangle has three waves within it, in this case of Minute degree.
So what happens after the Diagonal Triangle is complete? By my reading of the chart, that final high will mark the end of the Great Bull Market that began in 1974, and a major, years long decline will begin.
However, that would be the second time this year I’ve said that, only to be hit by a head-fake. I’m not yet signing on to that interpretation. Both declines this year, beginning in February and in September, proved to be false signal of a major bear market when the 2nd wave moved above the start of the preceding 1st wave.
Lesson learned: I don’t plan to call a major decline until I have a clear 3rd wave to the downside.
My trading strategy: Minor wave 4 within the diagonal triangle ought be a trading opportunity with options. Wave 5 as well. Insofar as my bear-oriented shares in SDS are concerned, I’ll be looking for an exit opportunity was wave 4 reaches its low point.
Learning and other resources. Elliott Wave International has long been the leading analytical house based on Elliott wave theory. They make available a number of free educational materials and other resources, in addition to their for-pay subscriptions.
I recommend two books, both by people associated with EWI.
First, Elliott Wave Principle by Robert Prechter and A.J. Frost is the book that, along with Prechter’s analyses, that created the revival of Elliott wave theory. I first read it in 1984, and it has had a profound influenced on my thinking about markets ever since.
Second, I’ve found Visual Guide to Elliott Wave Trading by Wayne Gorman and Jeffrey Kennedy, both of EWI, to be a useful book that relates Elliott wave theory to practical trading. The authors are hands-on Elliotticians, and for an active trader, that’s exactly what’s needed — less theory and more how-to. The first chapter of the book gives a very nice thumbnail run down of what Elliott wave theory is all about.
Terminology. Here are some links to information about some of the technical jargon I use.
Charts. On my charts, waves have a subscript showing the degree above or below the Intermediate degree. Here are the subscripts and the degree each represents:
- {+3} Supercycle
- {+2} Cycle
- {+1} Primary
- No subscript: Intermediate
- {-1} Minor
- {-2} Minute
- {-3} Minuette
By Tim Bovee, Portland, Oregon, November 9, 2020
Disclaimer
Tim Bovee, Private Trader tracks the analysis and trades of a private trader for his own accounts. Nothing in this blog constitutes a recommendation to buy or sell stocks, options or any other financial instrument. The only purpose of this blog is to provide education and entertainment.
No trader is ever 100 percent successful in his or her trades. Trading in the stock and option markets is risky and uncertain. Each trader must make trading decisions for his or her own account, and take responsibility for the consequences.
License
All content on Tim Bovee, Private Trader by Timothy K. Bovee is licensed under a Creative Commons Attribution-ShareAlike 4.0 International License.
Based on a work at www.timbovee.com.

[…] The S&P 500 has barely budged since peaking this morning after a rise that began overnight with the futures. The rise forced a reworking of my analysis See the new analysis here. […]
LikeLike
[…] The S&P 500 price moved above a significant level, requiring a rethinking of the Elliott wave analysis that had been in place for several months. See the analysis here. […]
LikeLike