10:15 a.m. New York time
The S&P 500 price moved above a significant level yesterday, requiring a rethinking of the Elliott wave analysis that had been in place for several months. See the analysis here.
What’s happening now? The S&P 500 index this morning continued to linger slightly below the upper boundary of the triangle that began on December 26, 2018.
What does it mean? The third wave of the five-wave triangle is complete and will soon start to decline to the lower boundary, presently in the low 2000s or even lower.
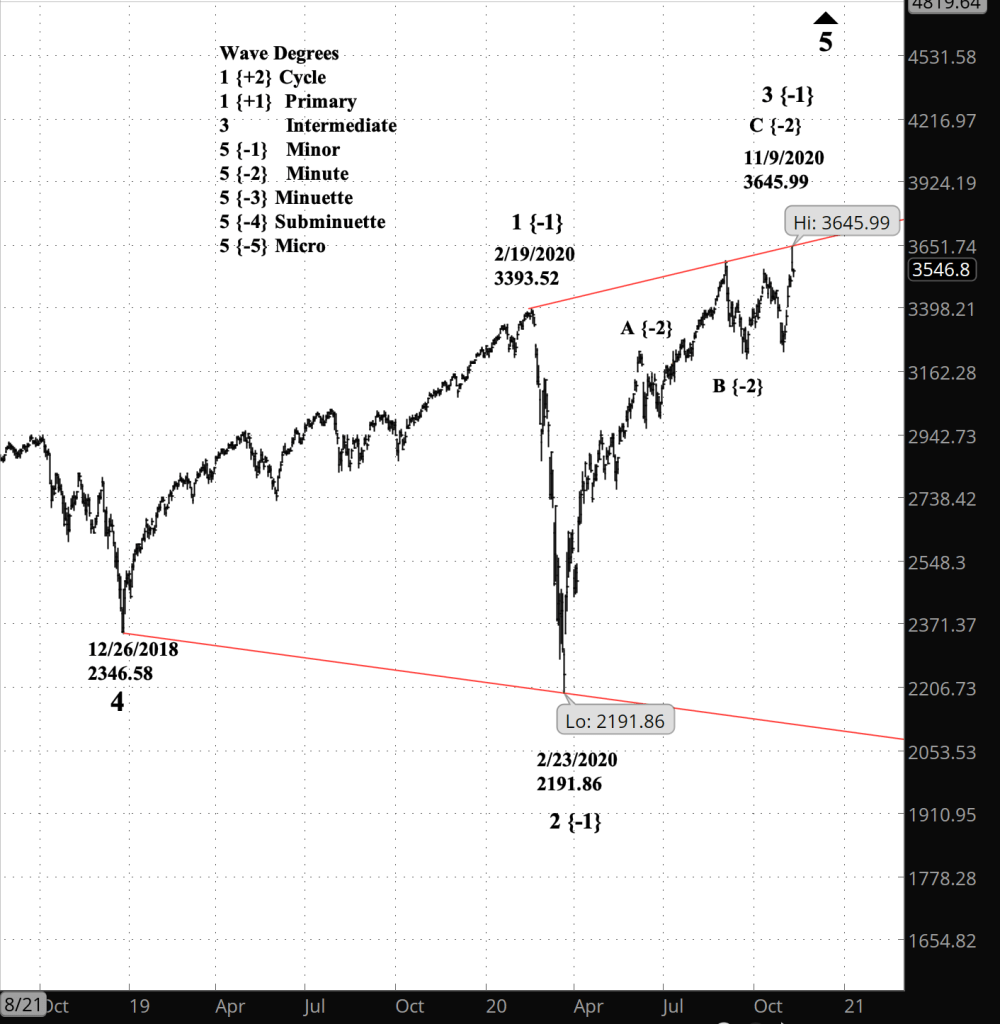
What does Elliott wave theory say? The structure that began in December 2018, from 2346.58, is an expanding Diagonal Triangle within the 5th wave of Intermediate degree.
Each wave within an expanding Diagonal Triangle is longer than the one before, bounding between boundaries that grow farther apart. So wave 4 of the triangle, just beginning, drops beyond the triangles starting point down to the low 2000s, if it moves swiftly, and even lower if it moves slowly. Minor wave 5 which follows will rise back to the 3700s, the upper boundary of the triangle next week, and even higher if it is a slow rise.
Each wave within the triangle has three subwaves, labelled A, B and C.
My trading strategy. The 4th wave decline will provide an opportunity to exit my shares in SDS, an inverse exchange-traded fund that profits when the S&P 500 falls. Whether I actually take profits depends upon the timing, since long-term capital gains (on stocks held for a year or longer) get a tax break in the U.S. I’m still looking at whether wave 4 would be a reasonable options play. Given the distances involved it seems reasonable at first glance, and if I decide to play it I’ll use a bear call spread structure for the options.
Learning and other resources. Elliott Wave International has long been the leading analytical house based on Elliott wave theory. They make available a number of free educational materials and other resources, in addition to their for-pay subscriptions.
I recommend two books, both by people associated with EWI.
First, Elliott Wave Principle by Robert Prechter and A.J. Frost is the book that, along with Prechter’s analyses, that created the revival of Elliott wave theory. I first read it in 1984, and it has had a profound influenced on my thinking about markets ever since.
Second, I’ve found Visual Guide to Elliott Wave Trading by Wayne Gorman and Jeffrey Kennedy, both of EWI, to be a useful book that relates Elliott wave theory to practical trading. The authors are hands-on Elliotticians, and for an active trader, that’s exactly what’s needed — less theory and more how-to. The first chapter of the book gives a very nice thumbnail run down of what Elliott wave theory is all about.
Terminology. Here are some links to information about some of the technical jargon I use.
Charts. On my charts, waves have a subscript showing the degree above or below the Intermediate degree. Here are the subscripts and the degree each represents:
- {+3} Supercycle
- {+2} Cycle
- {+1} Primary
- No subscript: Intermediate
- {-1} Minor
- {-2} Minute
- {-3} Minuette
By Tim Bovee, Portland, Oregon, November 10, 2020
Disclaimer
Tim Bovee, Private Trader tracks the analysis and trades of a private trader for his own accounts. Nothing in this blog constitutes a recommendation to buy or sell stocks, options or any other financial instrument. The only purpose of this blog is to provide education and entertainment.
No trader is ever 100 percent successful in his or her trades. Trading in the stock and option markets is risky and uncertain. Each trader must make trading decisions for his or her own account, and take responsibility for the consequences.
License
All content on Tim Bovee, Private Trader by Timothy K. Bovee is licensed under a Creative Commons Attribution-ShareAlike 4.0 International License.
Based on a work at www.timbovee.com.

You must be logged in to post a comment.