9:45 a.m. New York time
What’s happening now? The S&P 500 index continues its initial steps downward in the 4th leg of a Diagonal Triangle pattern that began in December 2018.
What does it mean? The downward movement is headed for the lower boundary of the Triangle, which is now in the 2100s. The slower the decline, the lower the boundary.
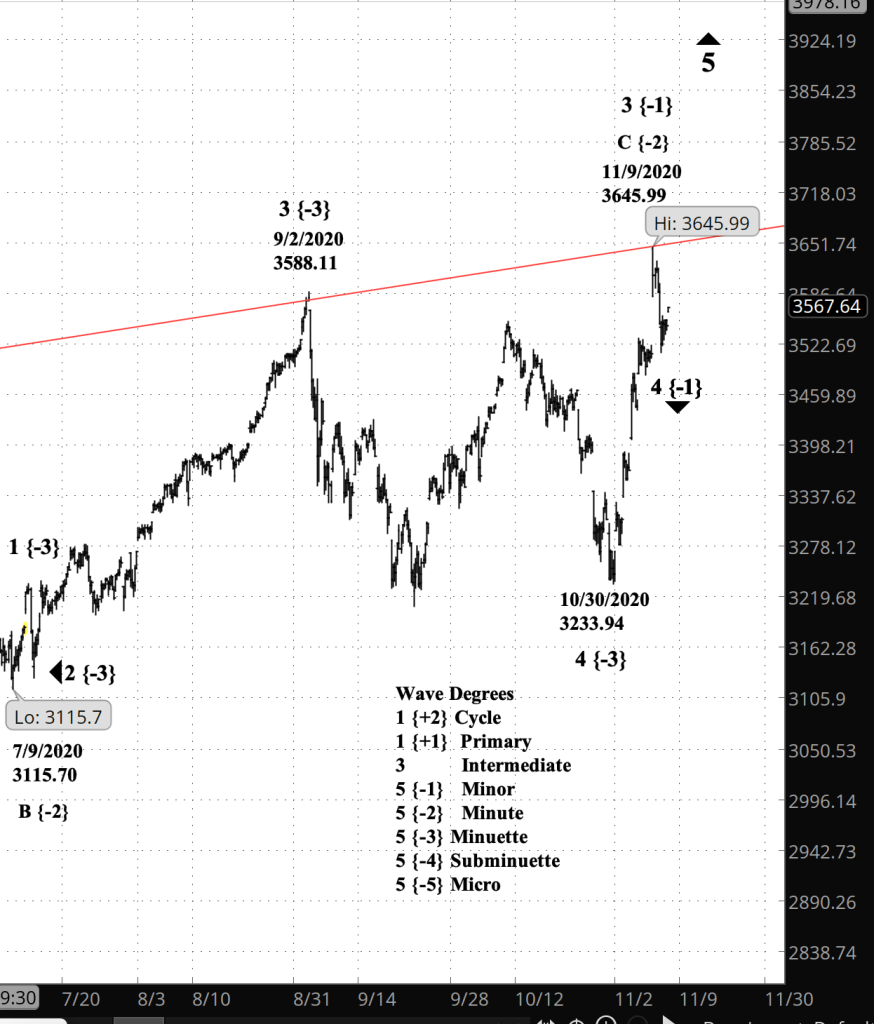
What does Elliott wave theory say? Minor wave 4 to the downside within Primary wave 5 to the upside is underway. Minor 4 will ultimately have three subwaves of Minuette degree. Minor 4 will be complete when it touches, or at least comes near to, the lower boundary of the Diagonal Triangle. After wave 4 is complete, Minor wave 5 will rise again to the upper boundary, completing Primary wave 5.
My trading strategy. Still in flux. Wave 4 might be a trading opportunity for options and an exit opportunity for my shares of SDS, an inverse fund based on the S&P 500. My goal now is to be sure that wave 4 is indeed complete.
Learning and other resources. Elliott Wave International has long been the leading analytical house based on Elliott wave theory. They make available a number of free educational materials and other resources, in addition to their for-pay subscriptions.
I recommend two books, both by people associated with EWI.
First, Elliott Wave Principle by Robert Prechter and A.J. Frost is the book that, along with Prechter’s analyses, that created the revival of Elliott wave theory. I first read it in 1984, and it has had a profound influenced on my thinking about markets ever since.
Second, I’ve found Visual Guide to Elliott Wave Trading by Wayne Gorman and Jeffrey Kennedy, both of EWI, to be a useful book that relates Elliott wave theory to practical trading. The authors are hands-on Elliotticians, and for an active trader, that’s exactly what’s needed — less theory and more how-to. The first chapter of the book gives a very nice thumbnail run down of what Elliott wave theory is all about.
Terminology. Here are some links to information about some of the technical jargon I use.
Charts. On my charts, waves have a subscript showing the degree above or below the Intermediate degree. Here are the subscripts and the degree each represents:
- {+3} Supercycle
- {+2} Cycle
- {+1} Primary
- No subscript: Intermediate
- {-1} Minor
- {-2} Minute
- {-3} Minuette
By Tim Bovee, Portland, Oregon, November 11, 2020
Disclaimer
Tim Bovee, Private Trader tracks the analysis and trades of a private trader for his own accounts. Nothing in this blog constitutes a recommendation to buy or sell stocks, options or any other financial instrument. The only purpose of this blog is to provide education and entertainment.
No trader is ever 100 percent successful in his or her trades. Trading in the stock and option markets is risky and uncertain. Each trader must make trading decisions for his or her own account, and take responsibility for the consequences.
License
All content on Tim Bovee, Private Trader by Timothy K. Bovee is licensed under a Creative Commons Attribution-ShareAlike 4.0 International License.
Based on a work at www.timbovee.com.

You must be logged in to post a comment.