After 4 p.m. New York time
At the close. And as it turns out, the S&P 500, a minute before the closing bell, pulled itself up to a higher high, 3699.20 on the index and 3700 on the E-mini futures.
3:30 p.m. New York time
Half an hour before the closing bell. The S&P 500 remains within five points or so of yesterday’s high, having barely budged throughout the day.
9:35 a.m. New York time
What’s happening now? The S&P 500 index and its derivatives remain at the upper boundary of a Diagonal Triangle that began in December 26, 2018. This morning is is trading slightly below the index’s December 3 peak of 3682.73.
What does it mean? Yesterday’s peak ended the middle wave of the rise that began March 23 from 2191.86. The next move will be significantly to the downside, followed by a rise back up to a new high, ending the triangle.
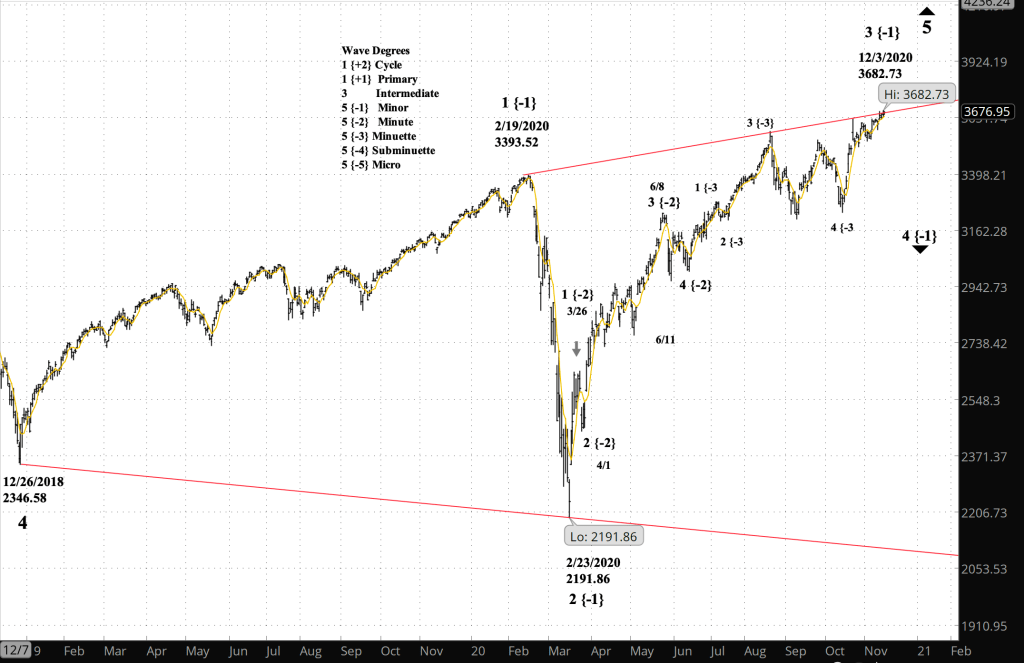
What does Elliott wave theory say? The December 3 peak marked the end of Minor wave 3 to the upside. The index is now in the early stages of a Minor wave 4 correction within Intermediate wave 5, an uptrending wave.
My trading strategy. I’m continuing to hold both my short bear call spread options positions and my bearish stock positions in the inverse exchange-traded fund SDS, which moves the opposite of the S&P 500;.
Learning and other resources. Elliott Wave International has long been the leading analytical house based on Elliott wave theory. They make available a number of free educational materials and other resources, in addition to their for-pay subscriptions.
I recommend two books, both by people associated with EWI.
First, Elliott Wave Principle by Robert Prechter and A.J. Frost is the book that, along with Prechter’s analyses, that created the revival of Elliott wave theory. I first read it in 1984, and it has had a profound influenced on my thinking about markets ever since.
Second, I’ve found Visual Guide to Elliott Wave Trading by Wayne Gorman and Jeffrey Kennedy, both of EWI, to be a useful book that relates Elliott wave theory to practical trading. The authors are hands-on Elliotticians, and for an active trader, that’s exactly what’s needed — less theory and more how-to. The first chapter of the book gives a very nice thumbnail run down of what Elliott wave theory is all about.
Terminology. Here are some links to information about some of the technical jargon I use.
Charts. On my charts, waves have a subscript showing the degree above or below the Intermediate degree. Here are the subscripts and the degree each represents:
- {+3} Supercycle
- {+2} Cycle
- {+1} Primary
- No subscript: Intermediate
- {-1} Minor
- {-2} Minute
- {-3} Minuette
By Tim Bovee, Portland, Oregon, December xx, 2020
Disclaimer
Tim Bovee, Private Trader tracks the analysis and trades of a private trader for his own accounts. Nothing in this blog constitutes a recommendation to buy or sell stocks, options or any other financial instrument. The only purpose of this blog is to provide education and entertainment.
No trader is ever 100 percent successful in his or her trades. Trading in the stock and option markets is risky and uncertain. Each trader must make trading decisions for his or her own account, and take responsibility for the consequences.
License
All content on Tim Bovee, Private Trader by Timothy K. Bovee is licensed under a Creative Commons Attribution-ShareAlike 4.0 International License.
Based on a work at www.timbovee.com.

[…] Intermediate degree. The upper boundary of the diagonal triangle that began in December 2018 (see Friday’s post for a chart) sets a loose limit on the upward potential, “loose” because prices will […]
LikeLike