3:30 p.m. New York time
Half an hour before the closing bell. The S&P 500 completed five waves down, completing what I have labelled wave 1 of Subminuette degree, an early step in what will gain clarity as the parent wave, the 4th of Minor degree. I have updated the E-mini futures chart, below.
10 a.m. New York time
What’s happening now? The S&P 500 index and its derivatives continue to trace a sideways pattern in the early stages of a downward correction within an uptrend.
What does it mean? There is very little upside potential on the chart, and the correction is likely to be shallow rather than a sharp downward plunge.
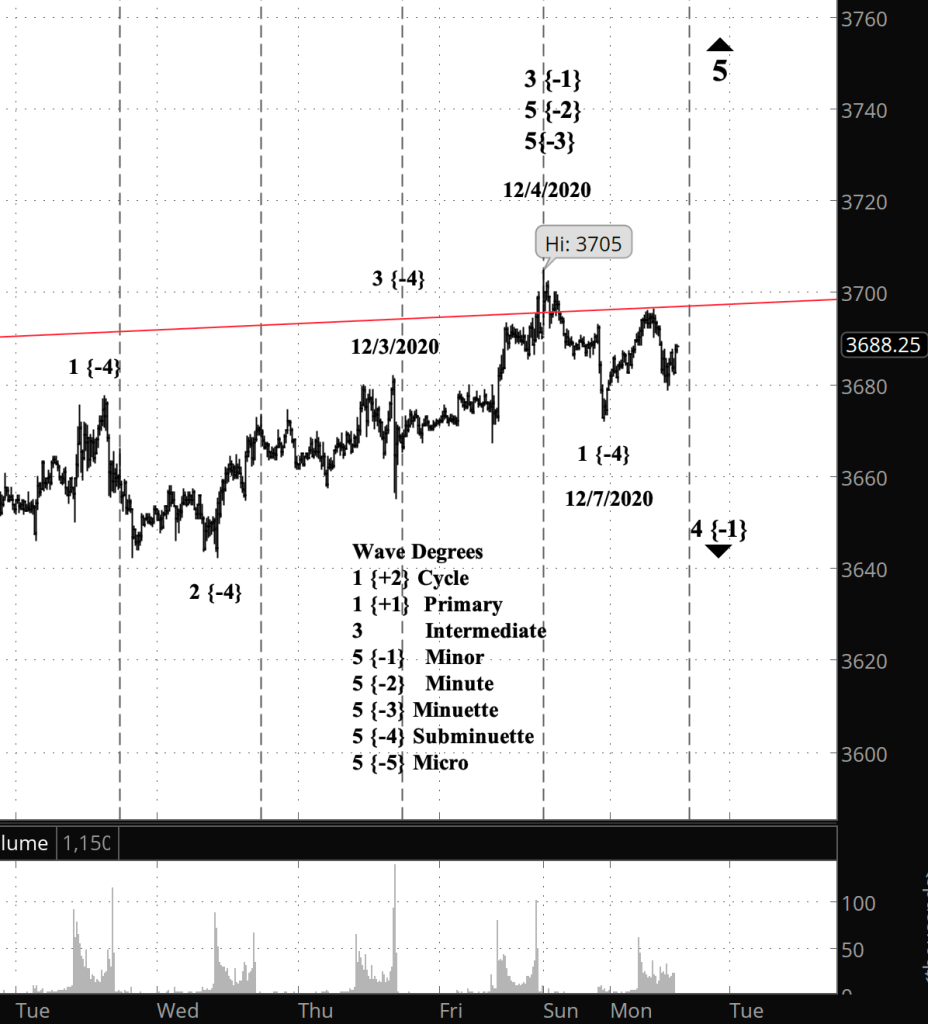
What does Elliott wave theory say? The downward correction is wave 4 of Minor degree within wave 5 of Intermediate degree. The upper boundary of the diagonal triangle that began in December 2018 (see Friday’s post for a chart) sets a loose limit on the upward potential, “loose” because prices will often move beyond such trend lines, in an overthrow, before returning to the area within the trend markers.
Fourth waves tend to be of a structure different than second waves. Wave 1 of Minor degree took the form of a Zig-zag, a steep decline, so wave 4 will most likely be a flat, and perhaps will extend in a compounds structure.
My trading strategy. My short bear call options spreads on IWM, expiring January 15, remain within what will eventually be the profit zone, and so I shall continue to hold the positions. My shares in SDS, an inverse S&P 500 exchange-traded fun, are unprofitable now but will return to profitability after Intermediate wave 5 completes its work.
Learning and other resources. Elliott Wave International has long been the leading analytical house based on Elliott wave theory. They make available a number of free educational materials and other resources, in addition to their for-pay subscriptions.
I recommend two books, both by people associated with EWI.
First, Elliott Wave Principle by Robert Prechter and A.J. Frost is the book that, along with Prechter’s analyses, that created the revival of Elliott wave theory. I first read it in 1984, and it has had a profound influenced on my thinking about markets ever since.
Second, I’ve found Visual Guide to Elliott Wave Trading by Wayne Gorman and Jeffrey Kennedy, both of EWI, to be a useful book that relates Elliott wave theory to practical trading. The authors are hands-on Elliotticians, and for an active trader, that’s exactly what’s needed — less theory and more how-to. The first chapter of the book gives a very nice thumbnail run down of what Elliott wave theory is all about.
Terminology. Here are some links to information about some of the technical jargon I use.
Charts. On my charts, waves have a subscript showing the degree above or below the Intermediate degree. Here are the subscripts and the degree each represents:
- {+3} Supercycle
- {+2} Cycle
- {+1} Primary
- No subscript: Intermediate
- {-1} Minor
- {-2} Minute
- {-3} Minuette
By Tim Bovee, Portland, Oregon, December 7, 2020
Disclaimer
Tim Bovee, Private Trader tracks the analysis and trades of a private trader for his own accounts. Nothing in this blog constitutes a recommendation to buy or sell stocks, options or any other financial instrument. The only purpose of this blog is to provide education and entertainment.
No trader is ever 100 percent successful in his or her trades. Trading in the stock and option markets is risky and uncertain. Each trader must make trading decisions for his or her own account, and take responsibility for the consequences.
License
All content on Tim Bovee, Private Trader by Timothy K. Bovee is licensed under a Creative Commons Attribution-ShareAlike 4.0 International License.
Based on a work at www.timbovee.com.

You must be logged in to post a comment.