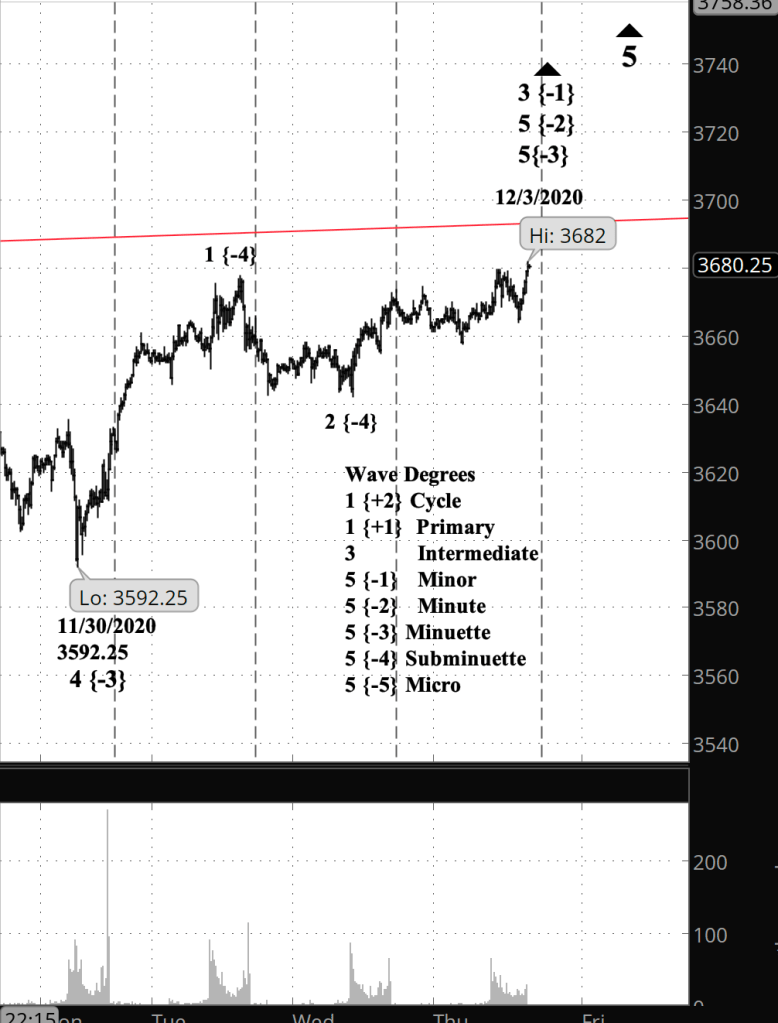
3:35 p.m. New York time
The S&P 500 index and futures moved above their high of December 1, extending the rise of Minor wave 3 and its subwaves. I’ve updated the chart, below, at half an hour before the closing bell.
10 a.m. New York time
What’s happening now? The S&P 500 index and its derivatives has completed one down-wave of five subwaves and one up-wave of three subwaves since the peak of December 1.
What does it mean? The pattern is typical of a downward correction.
What does Elliott wave theory say? The parent wave is a 4th of Minor degree, and the subwaves are A and B of Minute degree (or possibly one degree down, of Minuette degree). Wave B took back most of wave A, which as is typical of B behavior.
My trading strategy. Down is eventually profitable for my short bear call spread options positions, and the pattern shows a downtrend, so I’m in hold mode. Same with my shares of SDS, an inverse exchange-traded fund based on the S&P 500, with a long time horizon.
Read More »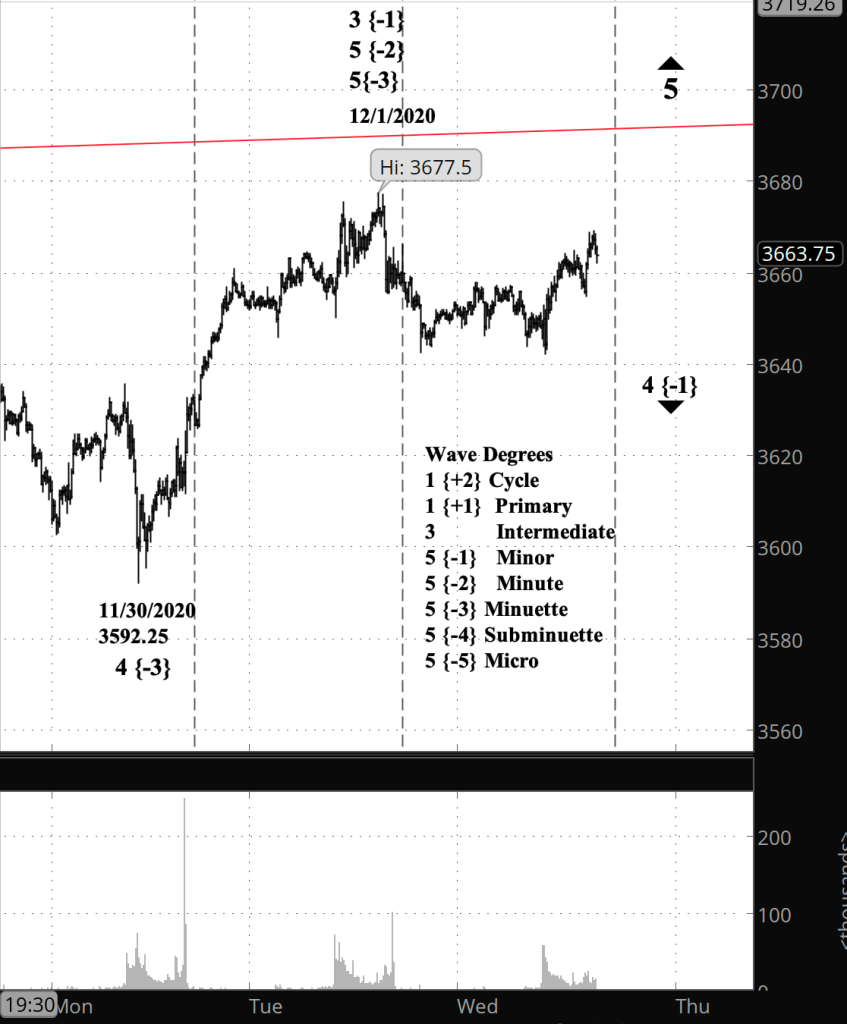


You must be logged in to post a comment.