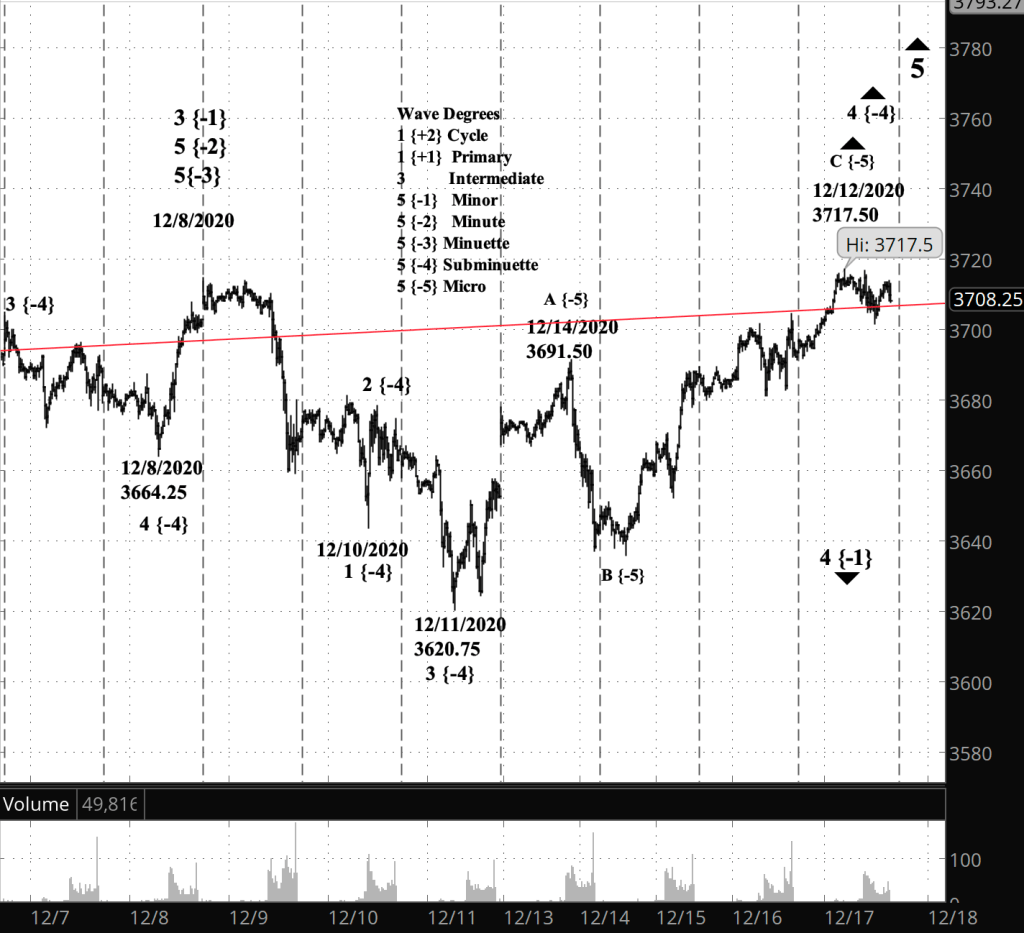
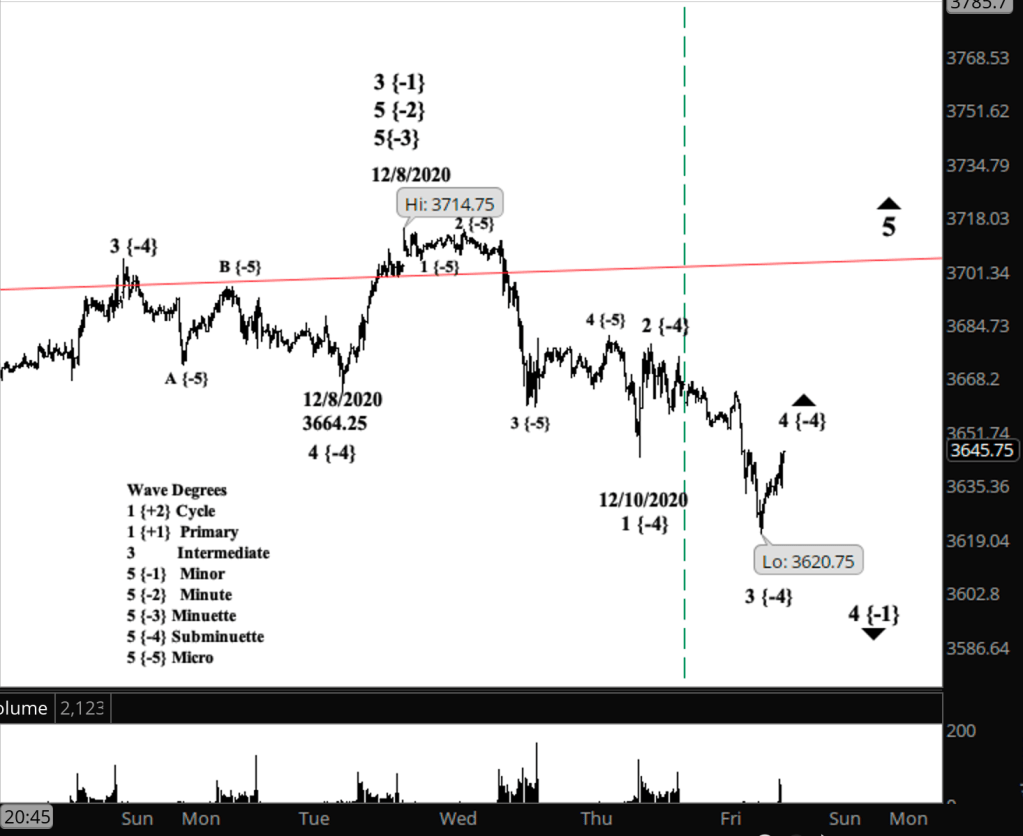
3:30 p.m. New York time
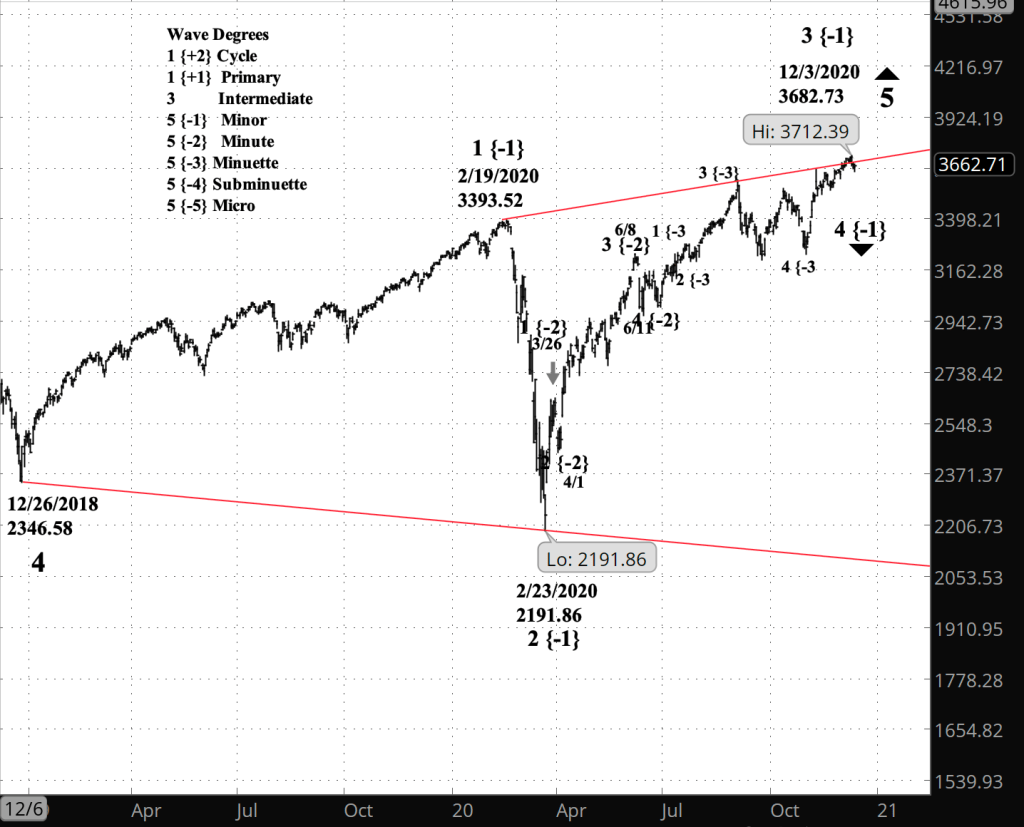
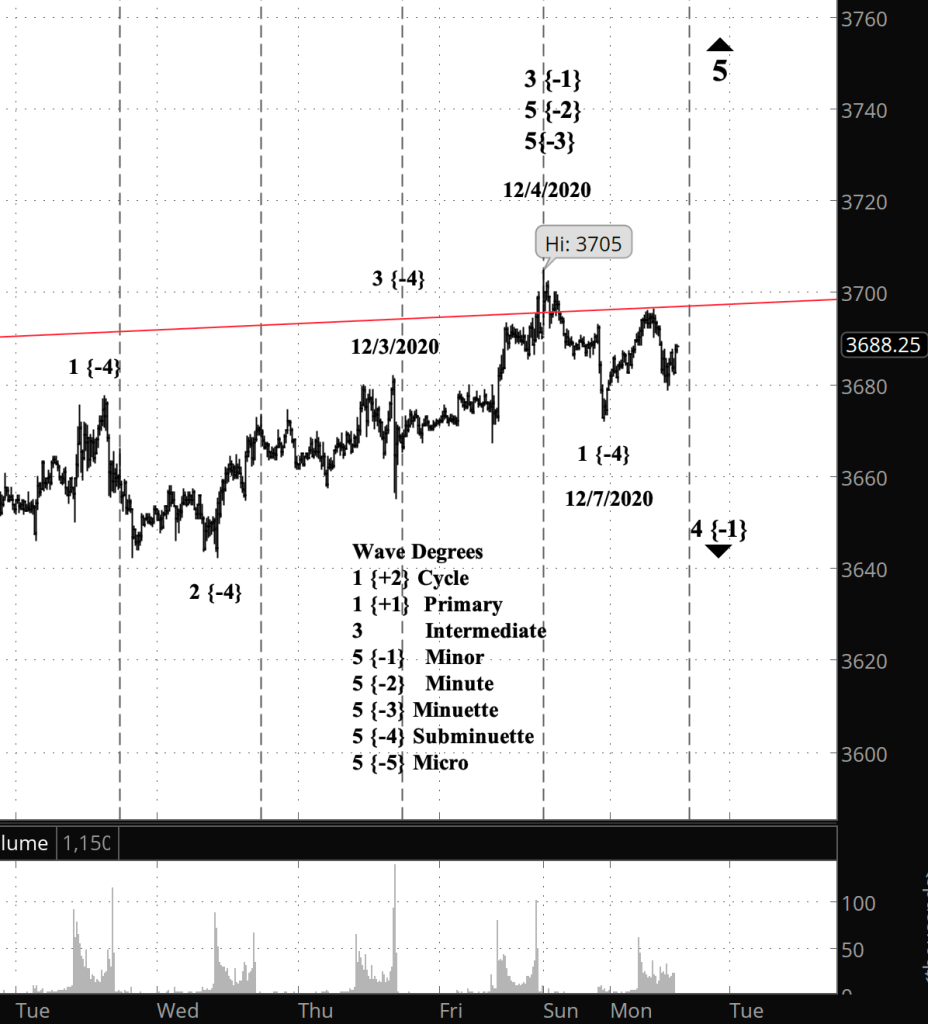
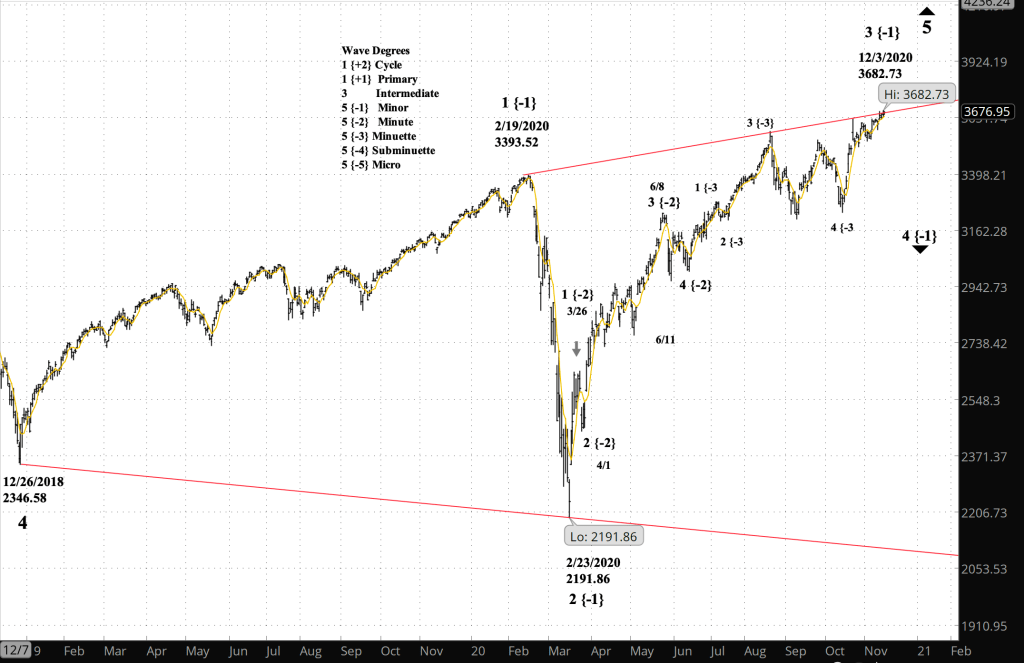
Half an hour before the closing bell. The S&P 500 futures continue to trade above the upper boundary of the Diagonal Triangle that began in December 2018 and that continues to define, roughly, the upper boundary of the present rise, the 5th wave of Intermediate degree. In today’s trading the price briefly dropped below the boundary but quickly bounced back, while remaining below the high, 3717.50 (3725.12 on the index), that may mark the peak of the upward correction, wave 4 of Subminuette degree. I’ve updated the chart below.
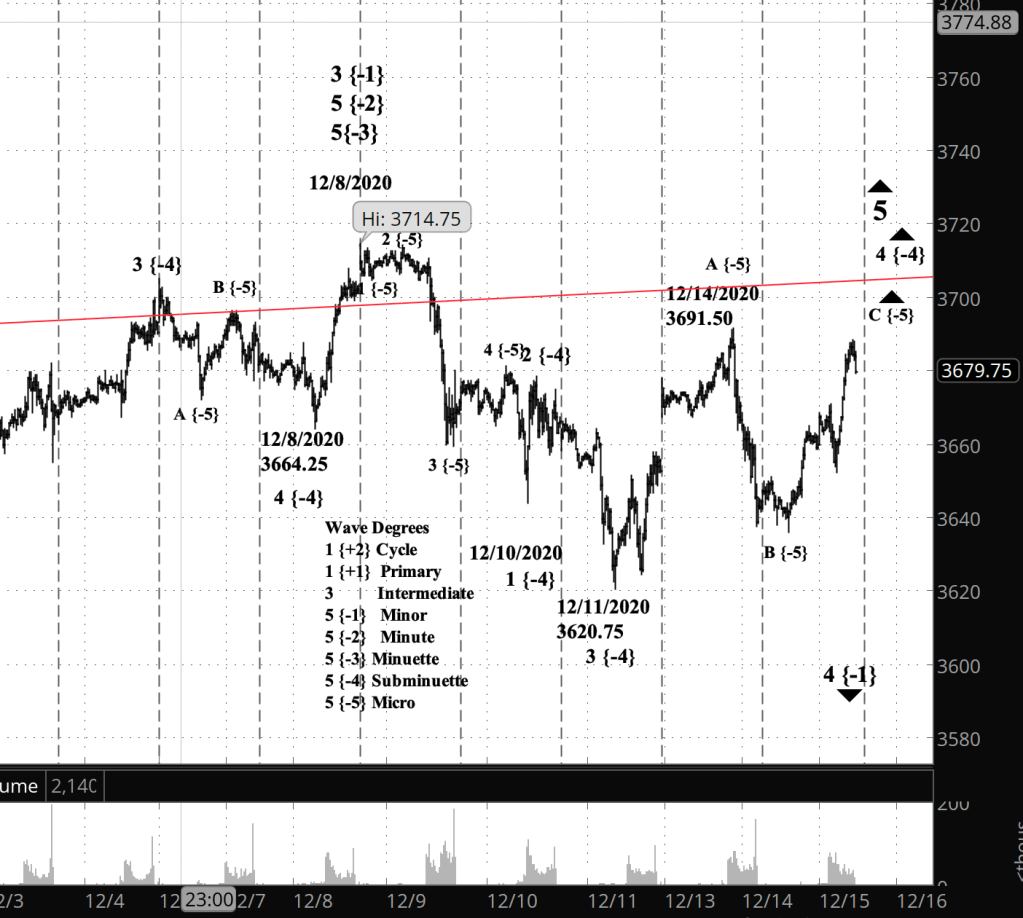
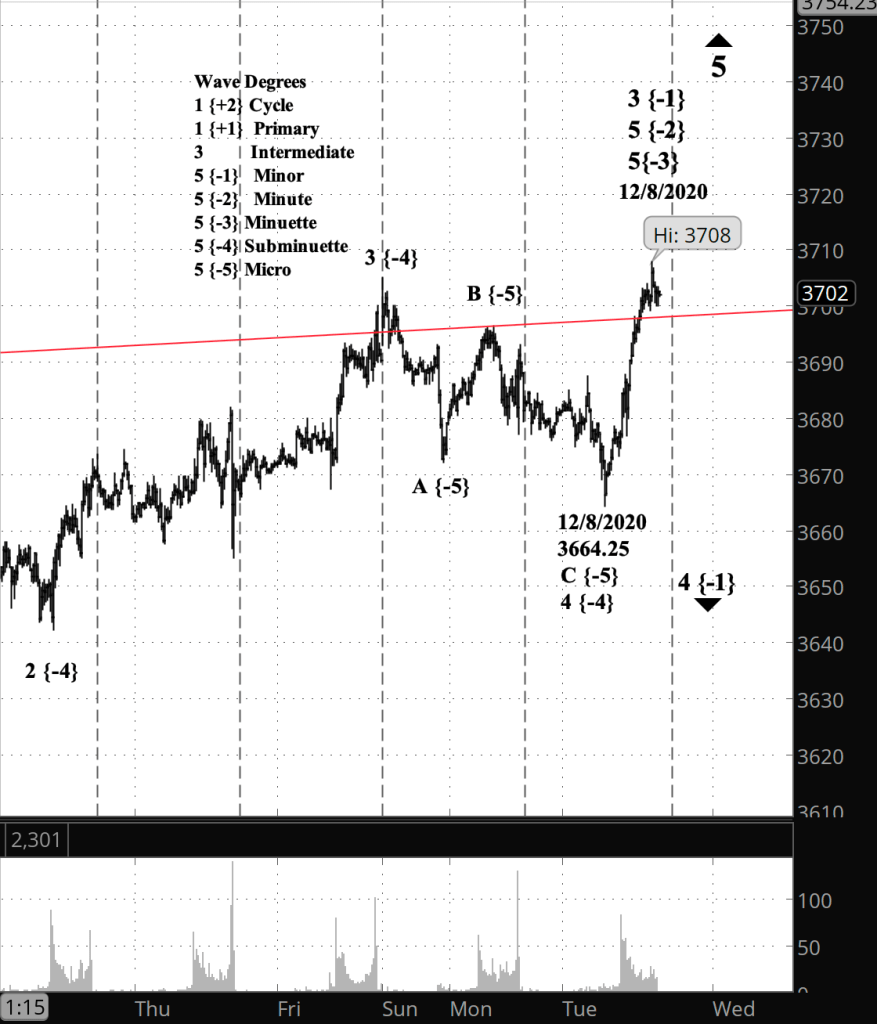
9:35 a.m. New York time
What’s happening now? In the hour before the opening bell the S&P 500 E-mini futures index rose to 3717.50 and reversed.
What does it mean? That level fulfills all of the qualifications of the final subwave of the upward correction that began December 11. However, the upward correction could move still higher, it could reverse and then add another corrective pattern, or it could signal the end of the upward correction and the beginning of a downtrend reaching into the 3600s or below.
What does Elliott wave theory say? The upward correction is wave 4 of Subminuette degree, which is in its 5th wave and may in fact have completed it. The subwave is wave C of Micro degree, and within it are five subwaves, as required by the rules of Elliott analysis.
Read More »

You must be logged in to post a comment.