After the closing bell
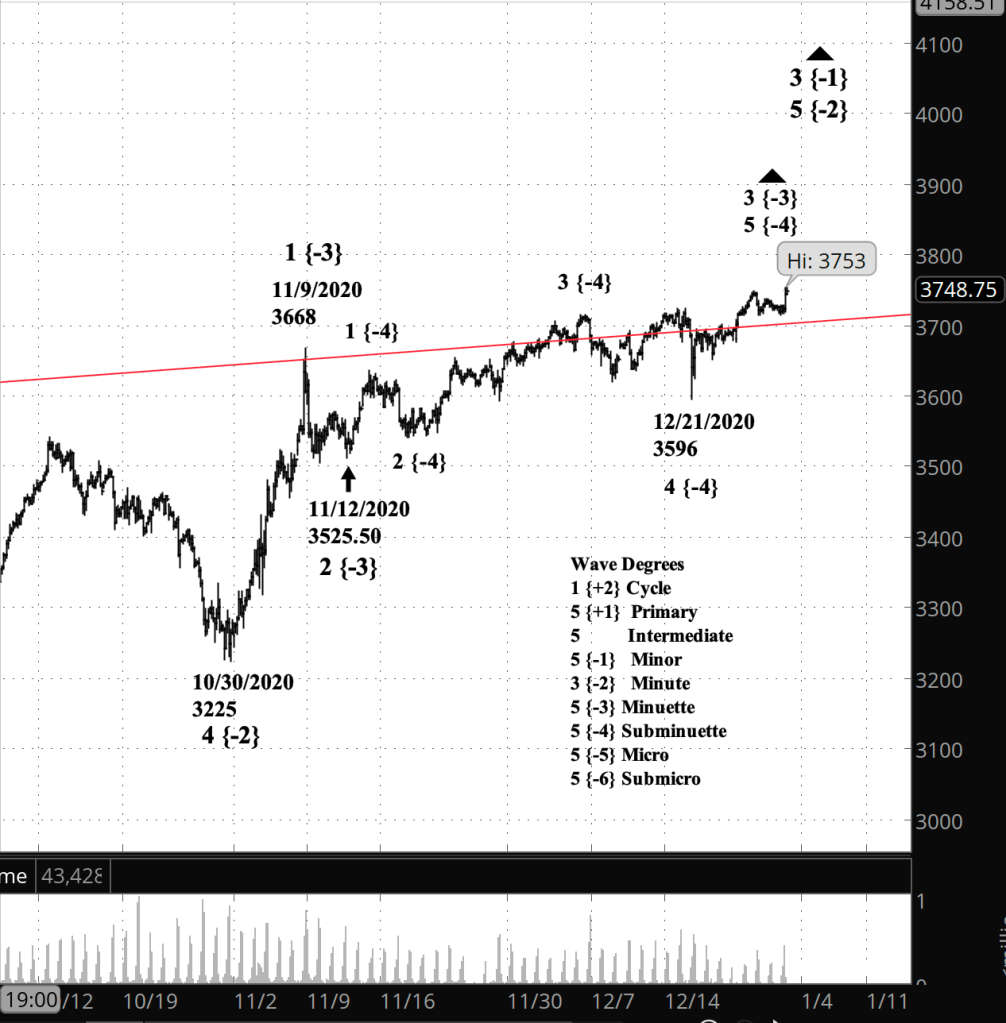
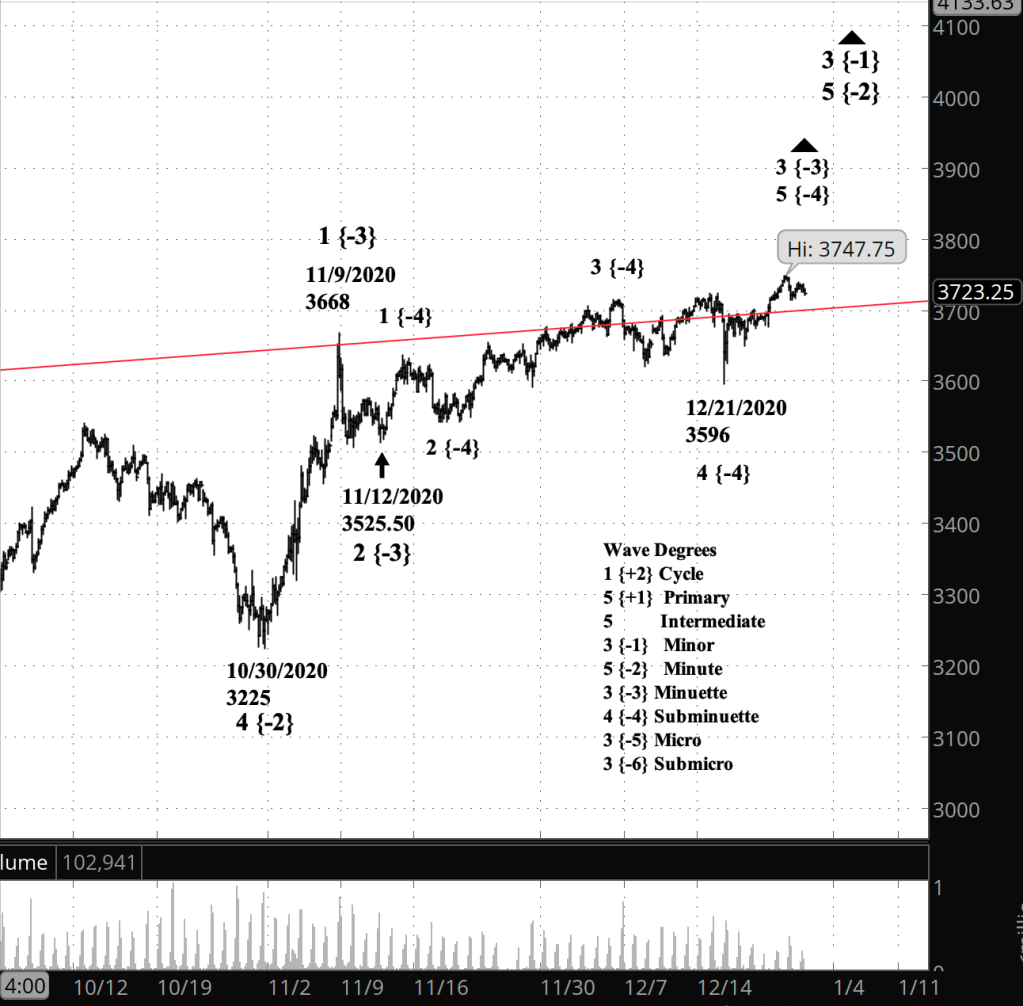
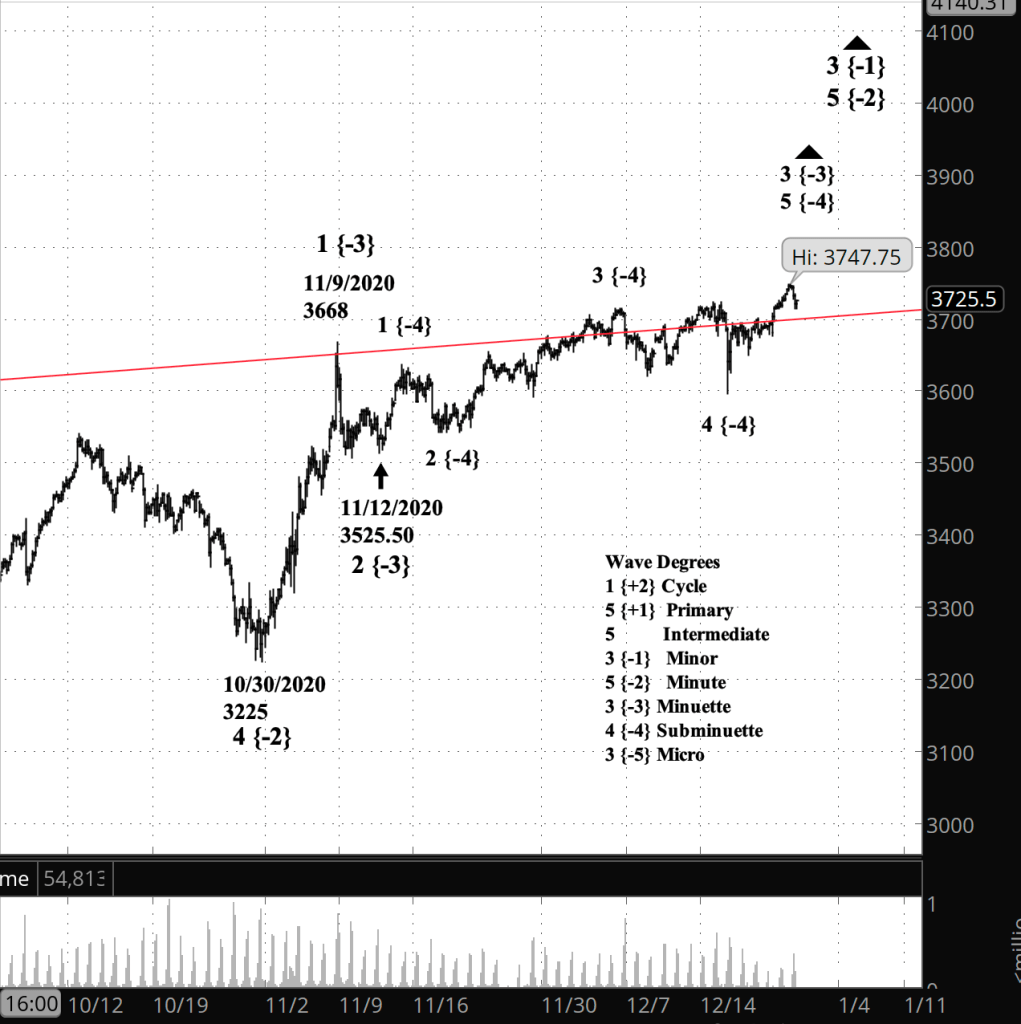
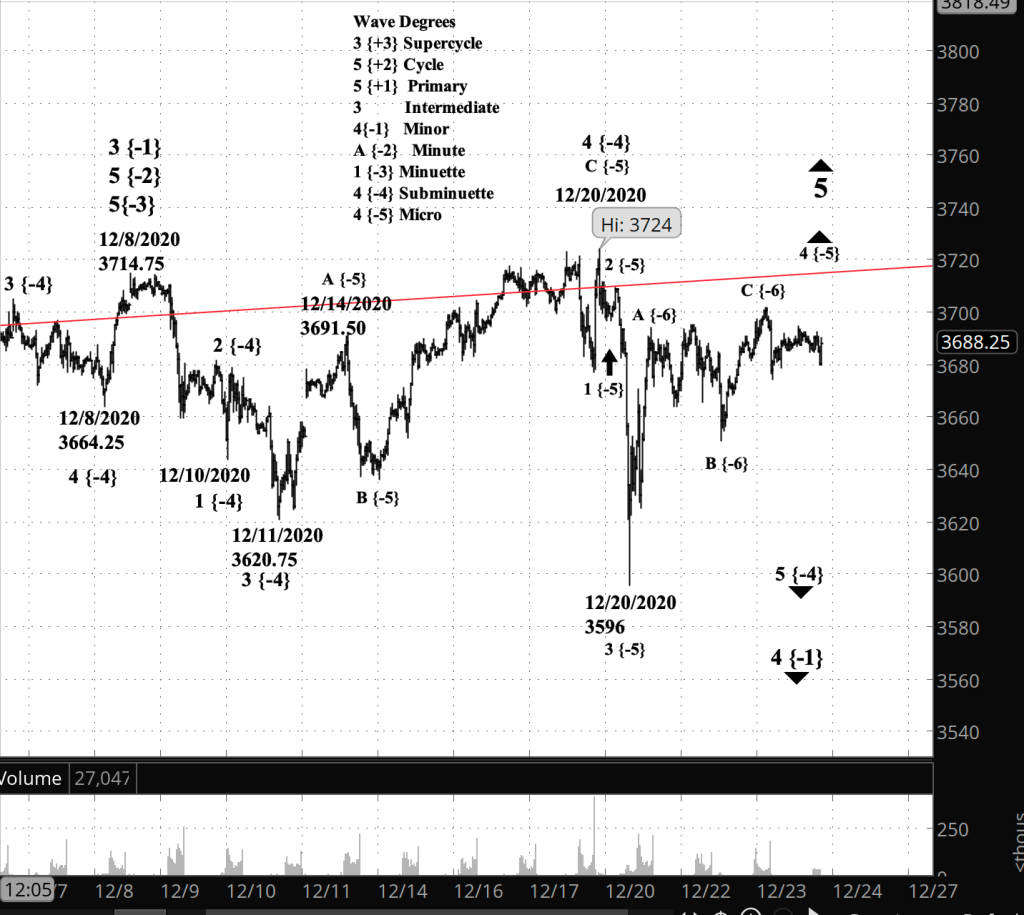
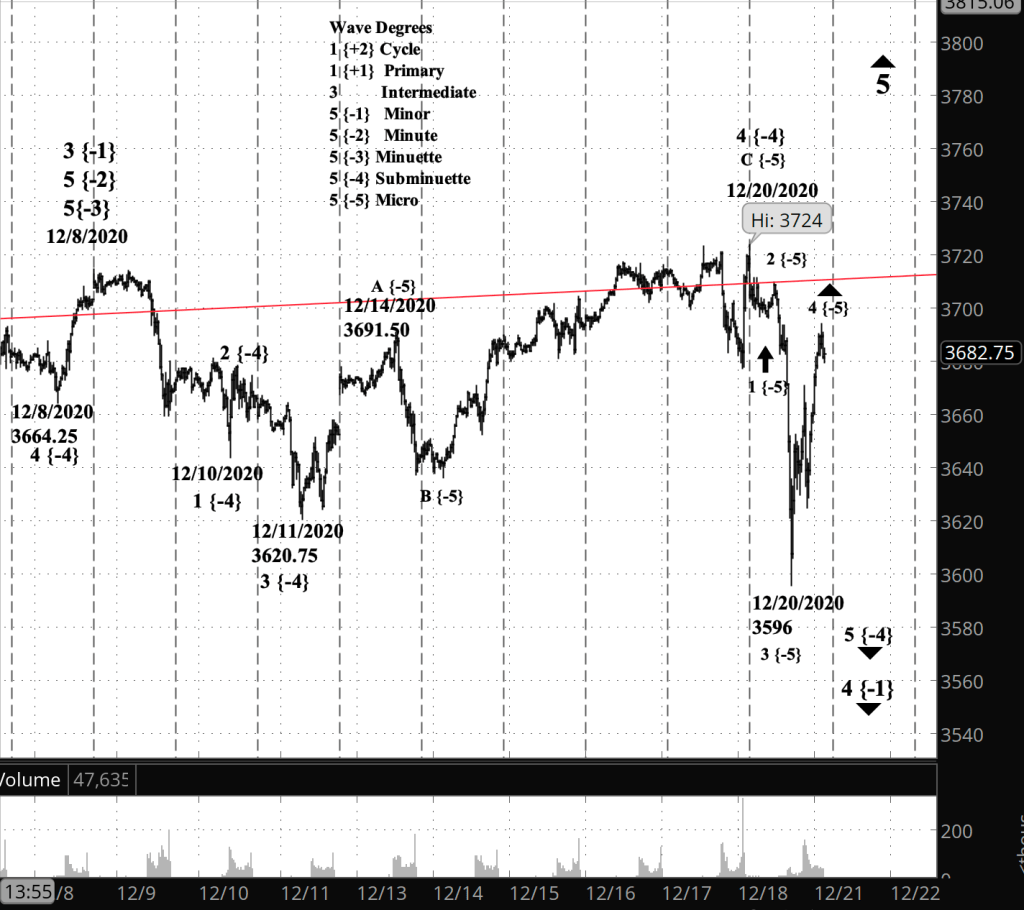
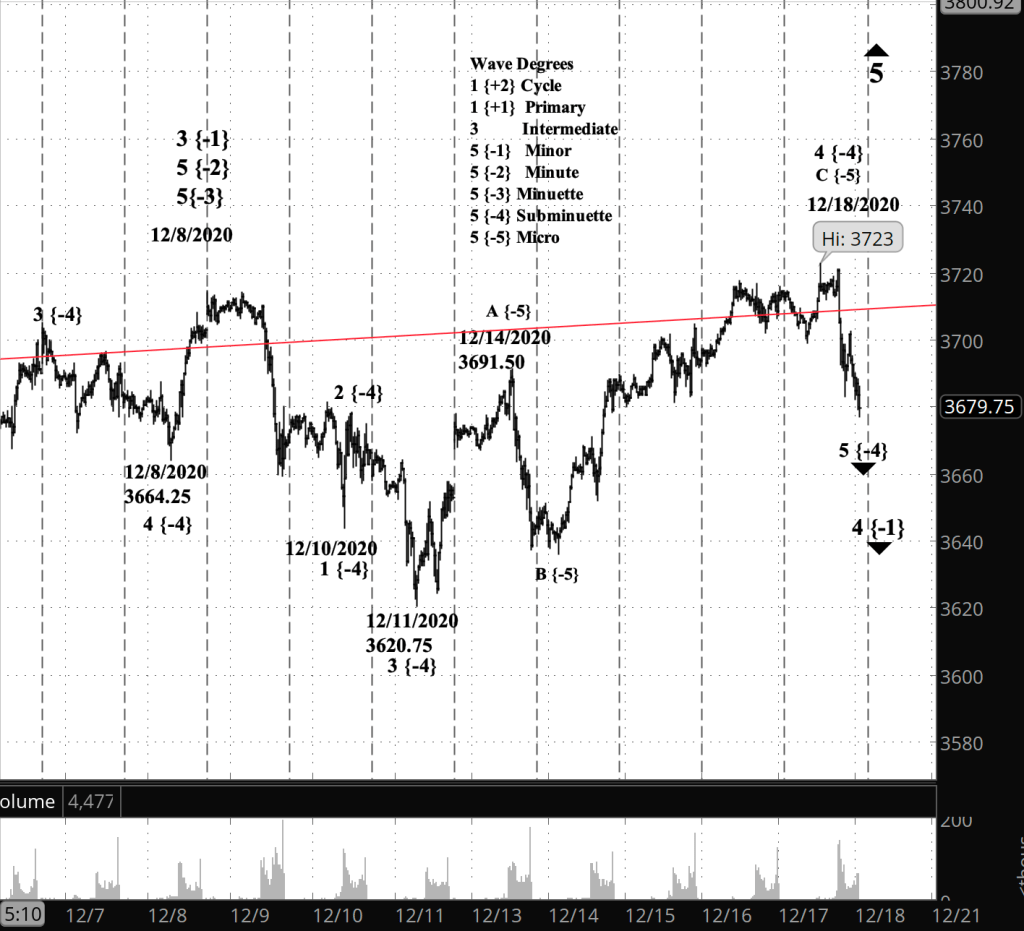
In the end, the S&P 500 and its derivatives bumped up slightly to set a new high. To me, it looks like the beginning of wave 5 of Micro degree within wave 5 of Subminuette degree.
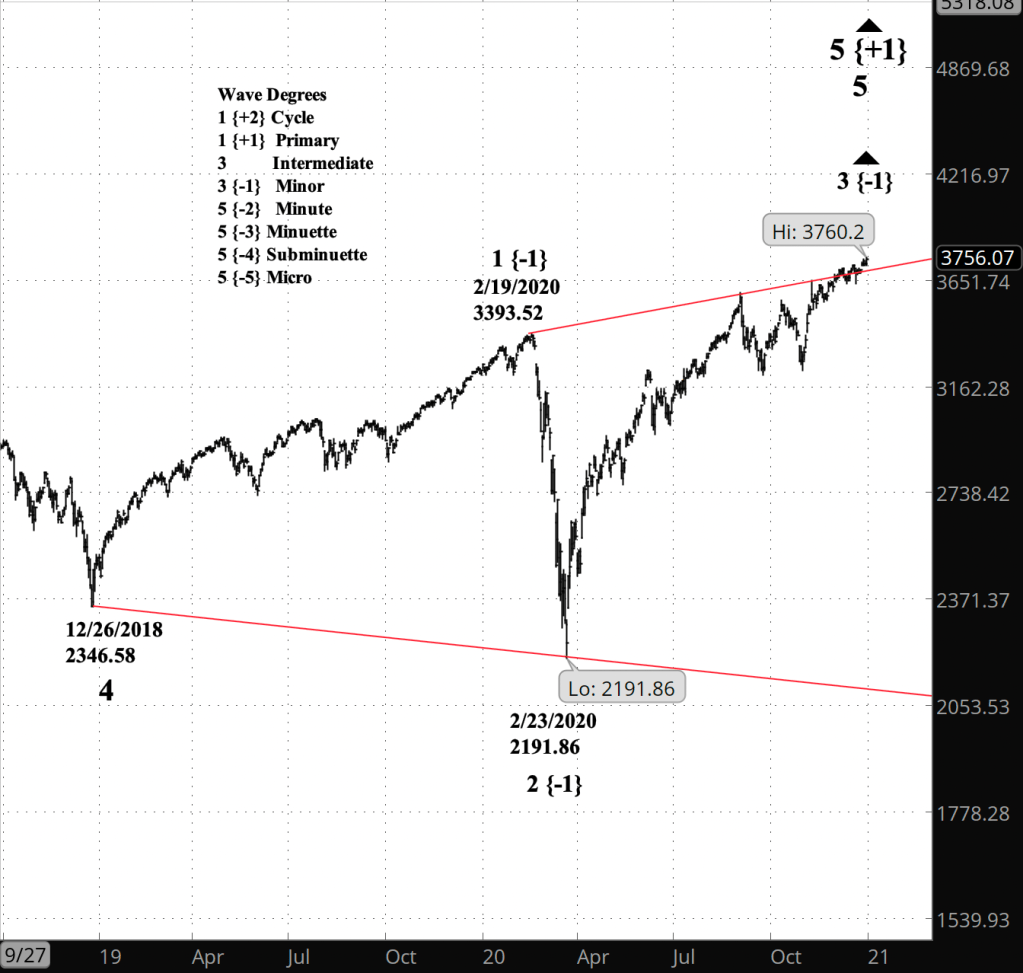
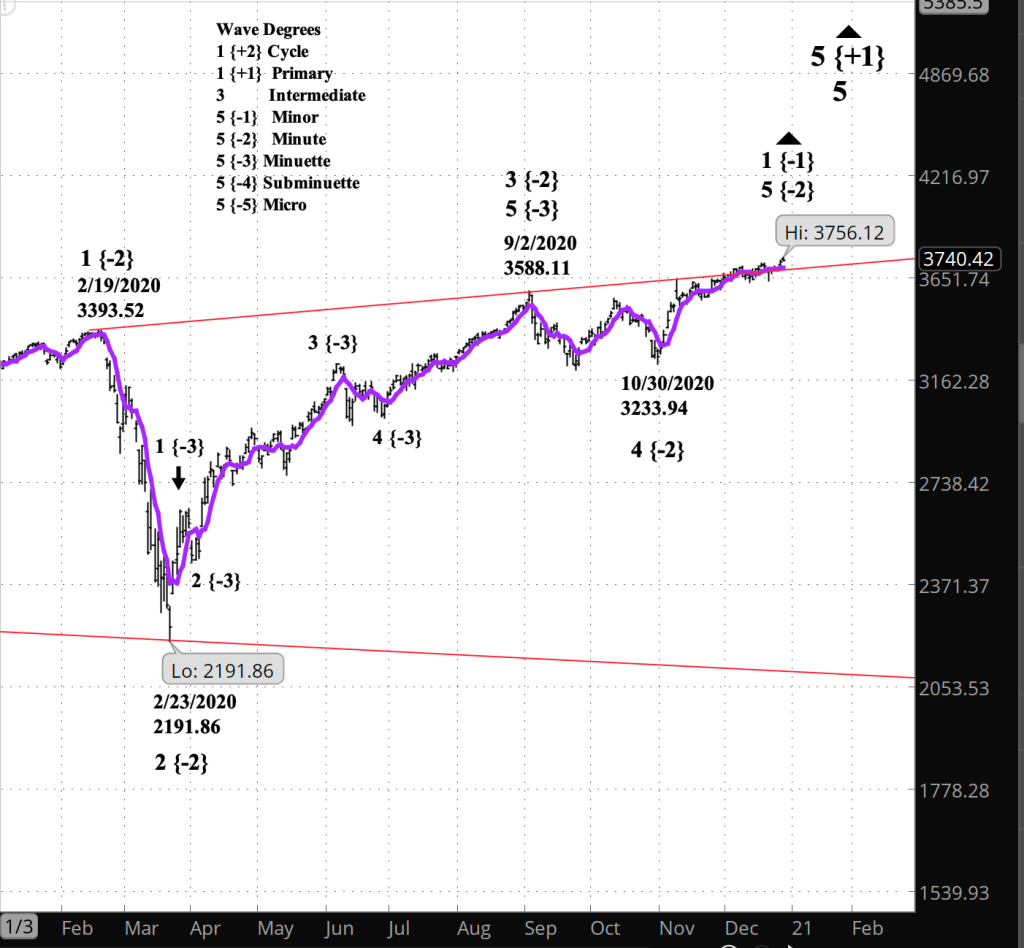
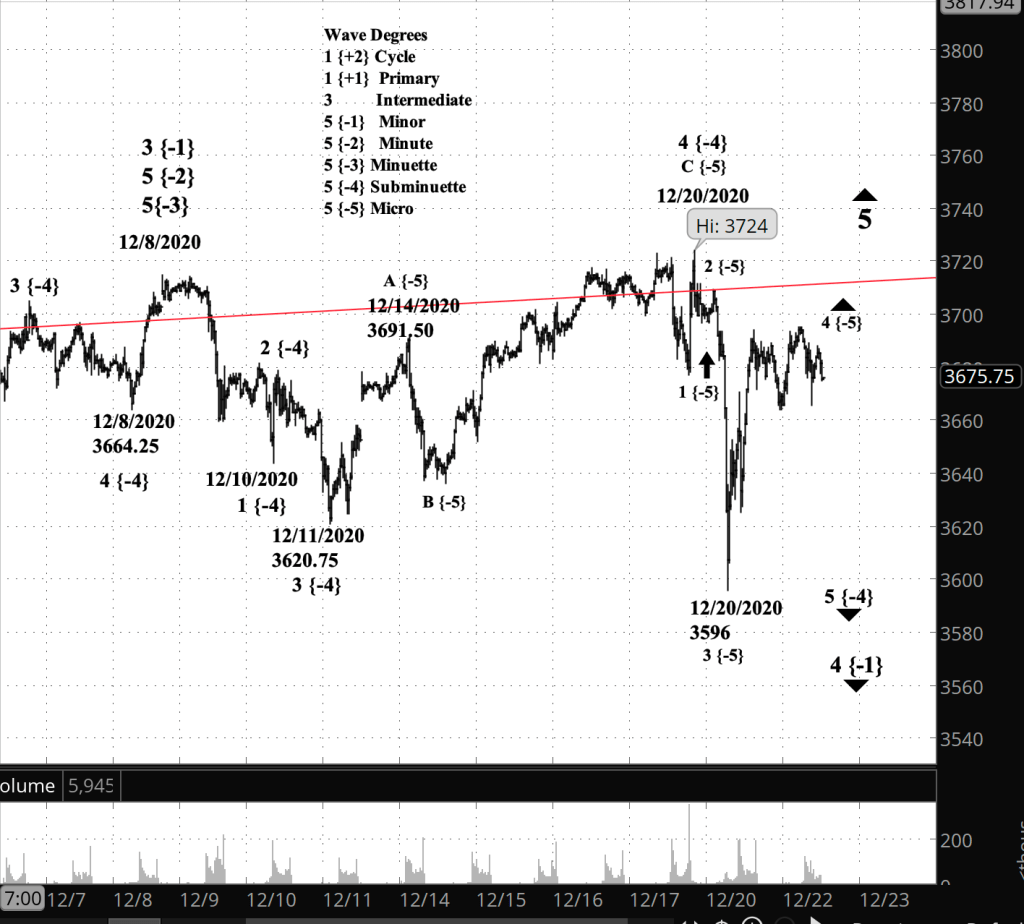
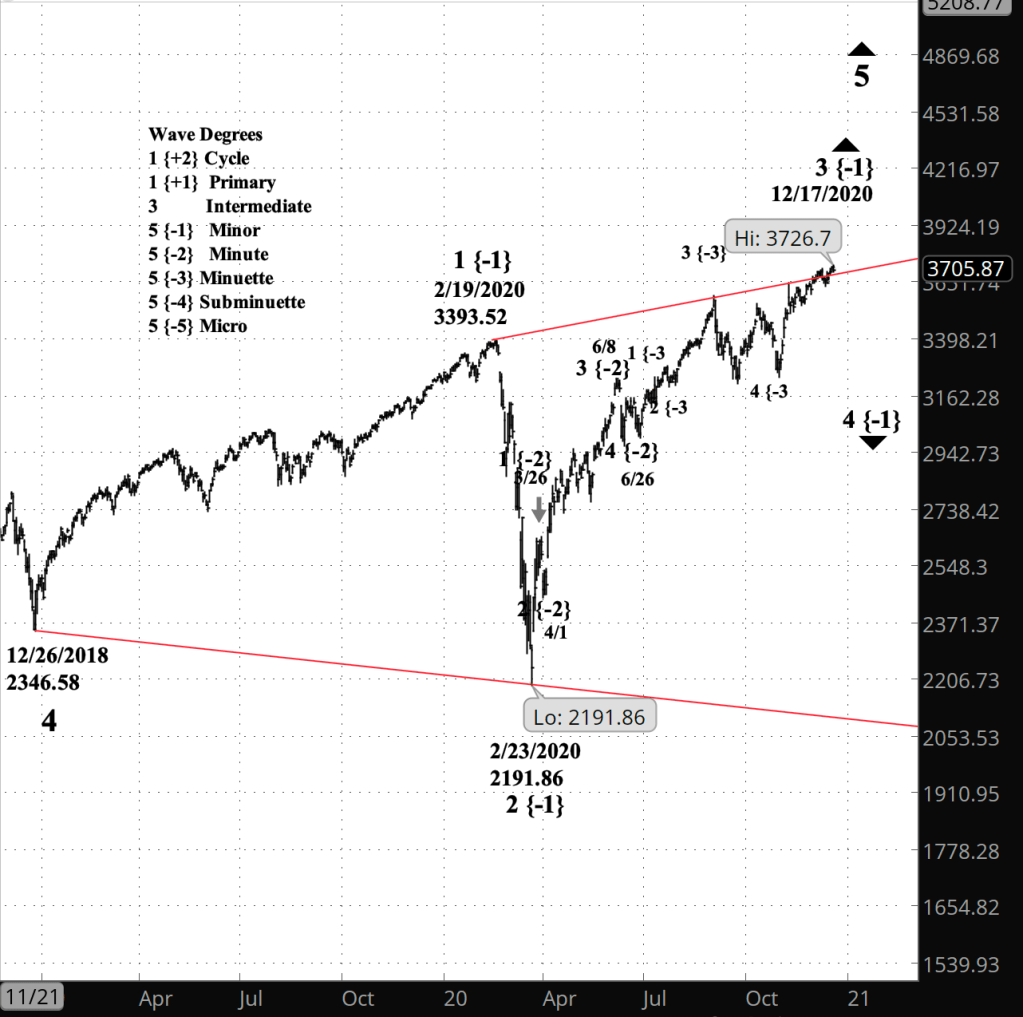
Stepping back to a broader view, we can see how far along the price has come since the present Diagonal Triangle began on December 26, 2018. The Triangle wave 5 of Intermediate degree, and each bounce up or down to a triangle boundary is a Minor wave. By my count, the S&P 500 is working on wave 5 of Minor degree. A Diagonal Triangle has five waves internally, so the end is near.
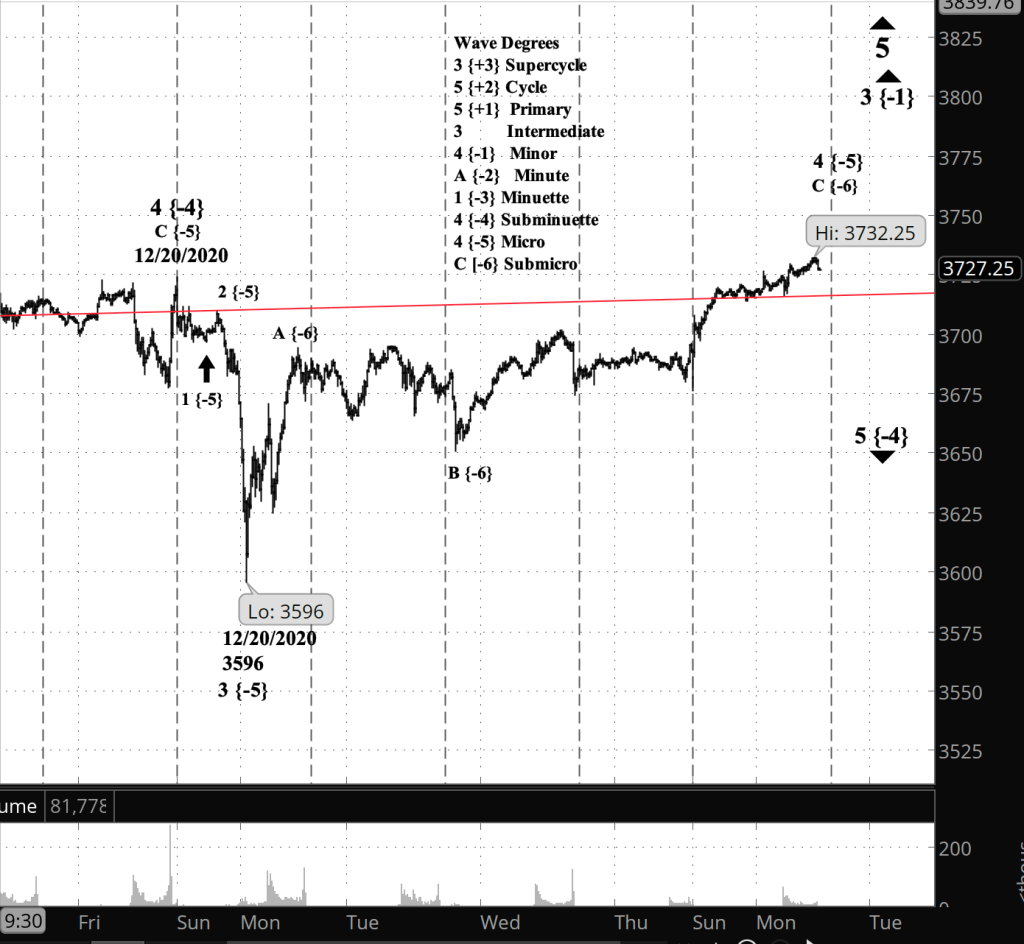
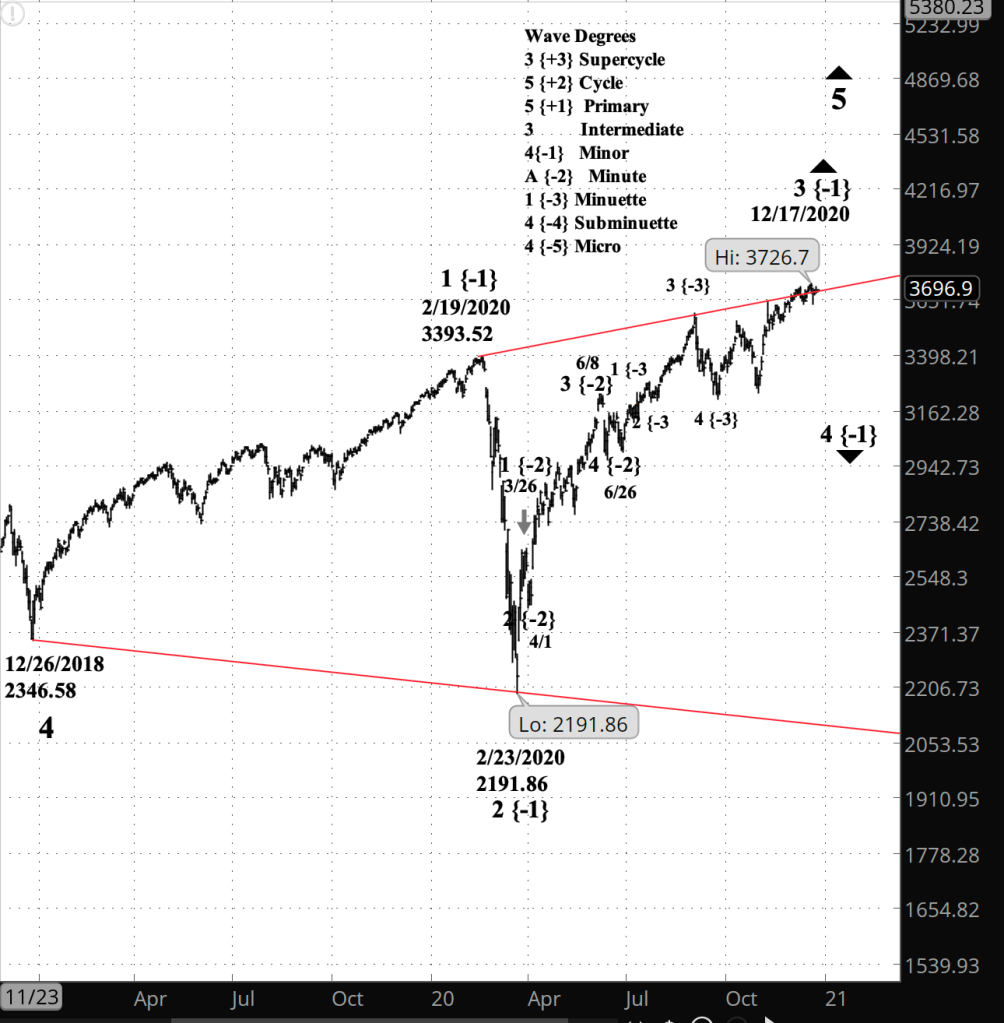
And finally, the long view, showing how we got to where we are: Intermediate wave 5 within Primary 5 within Cycle 5 within wave 5 of Supercycle degree. Looking back at the close-up chart at the top, I’m struck by the fact that the whole house of cards stretching back 91 years is poised to come tumbling down when today’s Submicro wave 5 within Micro 5 within Subminuette 5 within Minuette 5 within Minute 5 within Minor 5 reach an end. Perhaps even next year.
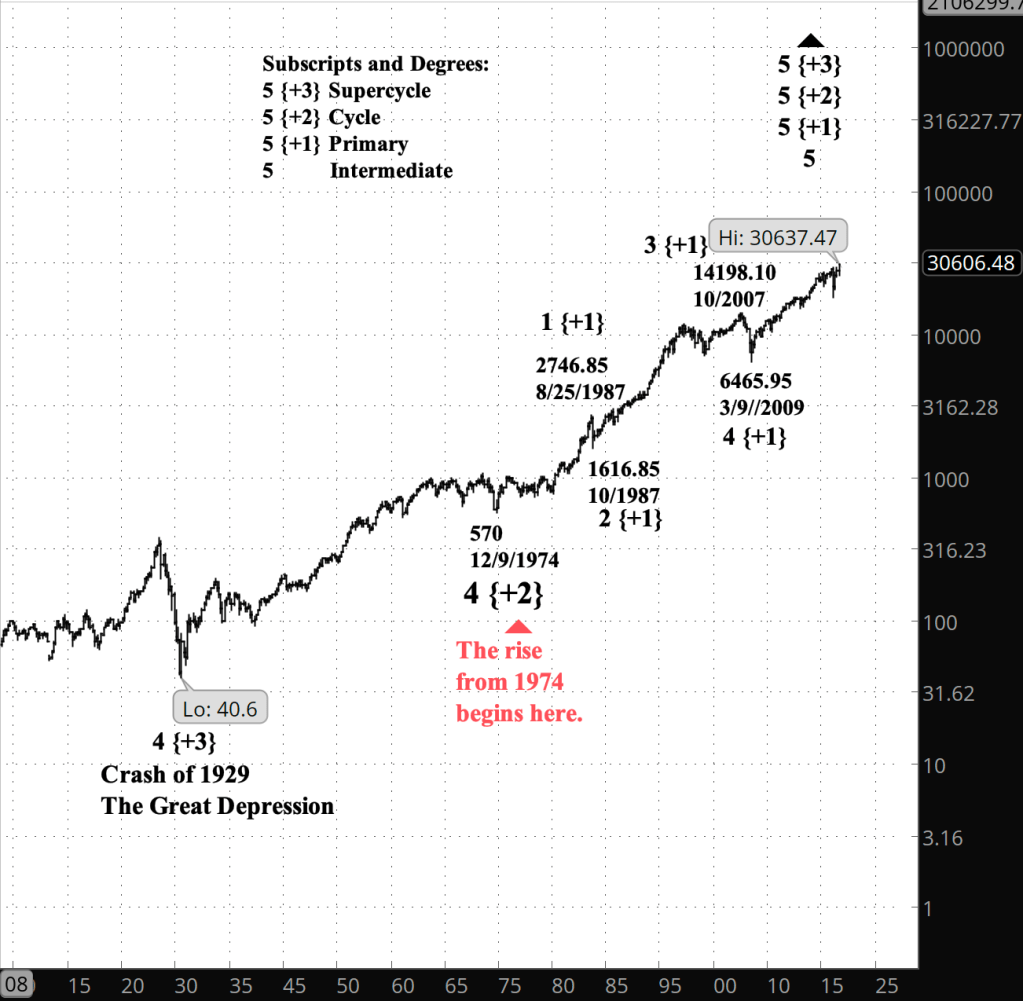
Of 2020, I doubt that any of us can say it was pleasant or easy. But when I look at this long-view chart, honestly, all of the crashes and crises and Sturm und Drang we’ve seen in 2020 — this year of roughhouse politics and plague — in the grand sweep of history seem fairly small in their impact on the markets. After all, we’ve been in an uptrend since the Black Tuesday crash of October 29, 1929, and that uptrend, despite all that has happened since, remains intact as 2020 comes to an end.
By Tim Bovee, Portland, Oregon, December 31, 2020
Read More »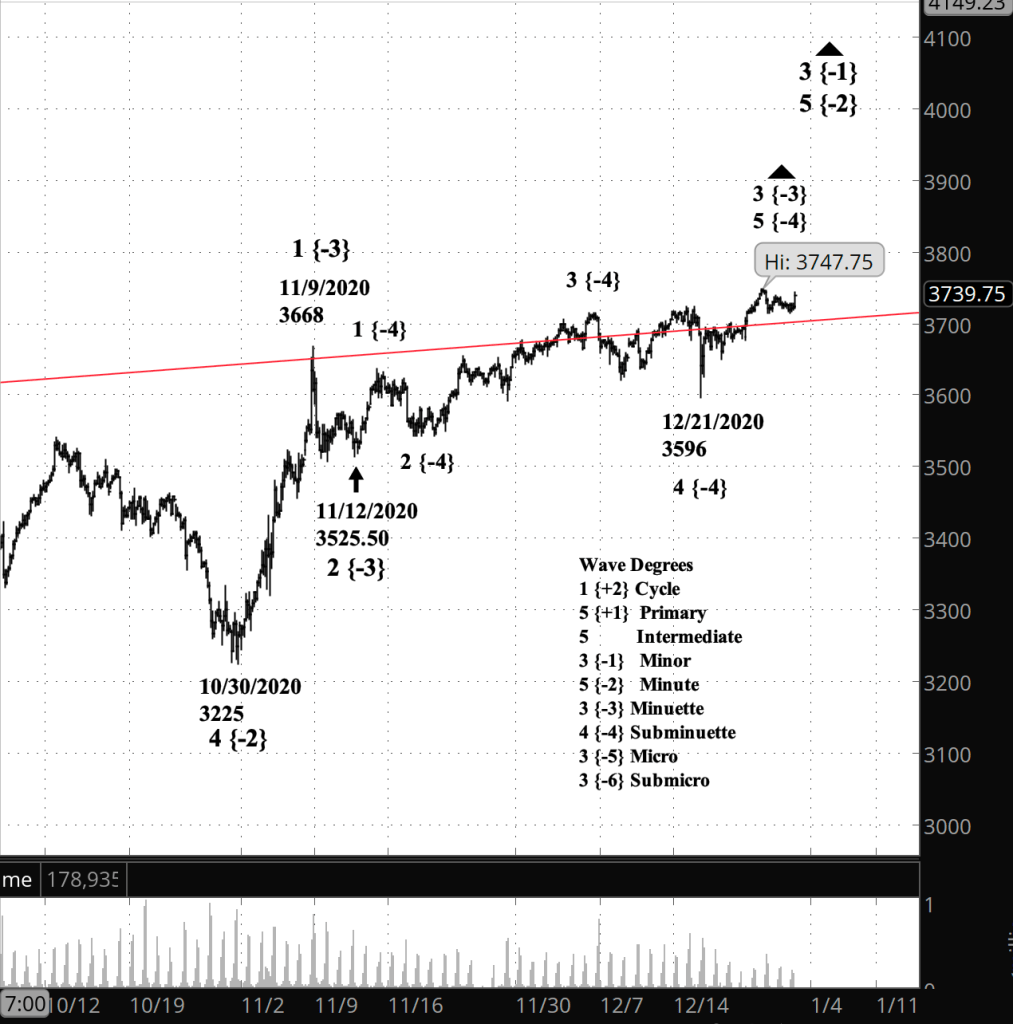

You must be logged in to post a comment.