3:30 p.m. New York time
Half an hour before the closing bell. Close up, the S&P 500 has retraced nearly all of its decline. The question remains open whether the rise is the start of wave 5 of Micro degree or the beginning of a wave X, separating two corrective patterns.
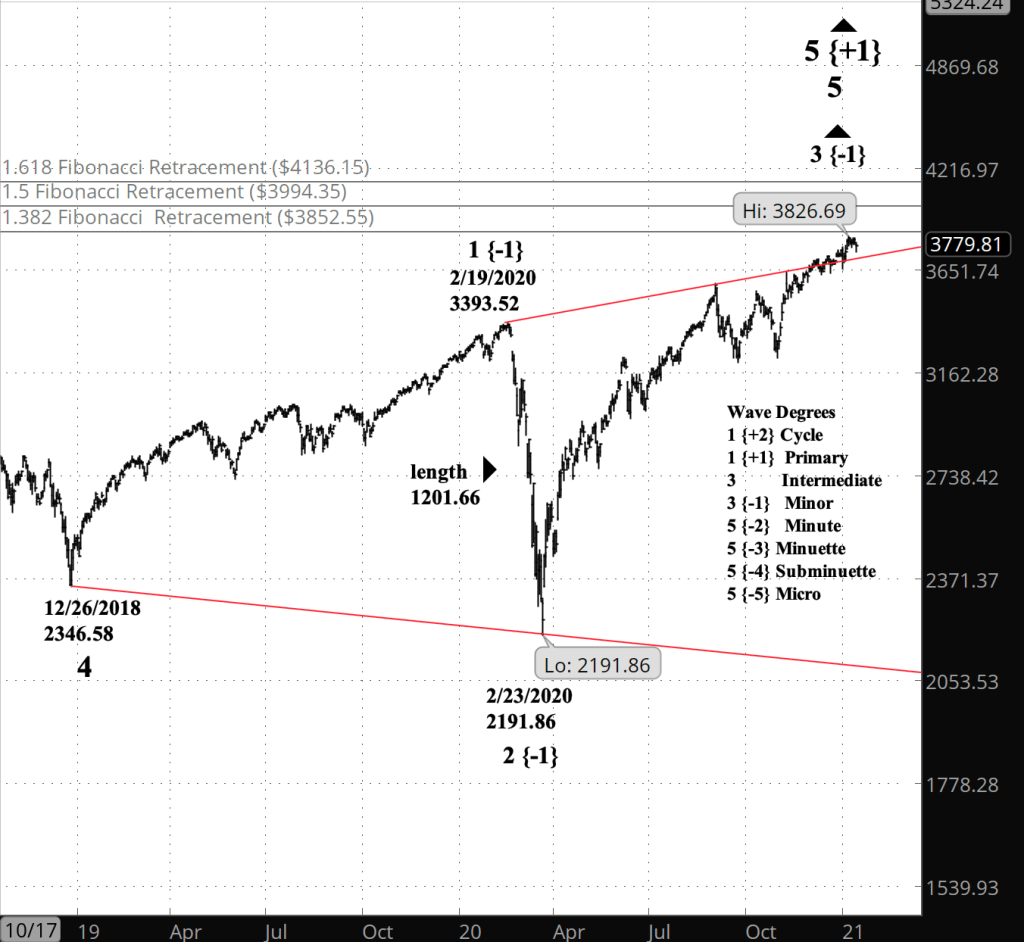
Big picture, the S&P 500 remains below the 1.382% Fibonacci retracement level, which would be a typical turning point for the rise since February 23.
I’ve updated the near-term chart below. I’ve also corrected the last graf Elliott wave discussion to label the red line as the upper boundary (not lower) of the Diagonal Triangle that began in December 2018.
10:40 a.m. New York time
What’s happening now? The S&P 500 E-mini futures fell at the opening, entering the third and final segment of the correction that began January 8.
What does it mean? The end of the correction will be followed by either a rise that will be the end of the uptrend that began January 4, or will rise and form a second corrective pattern in a compound correction.
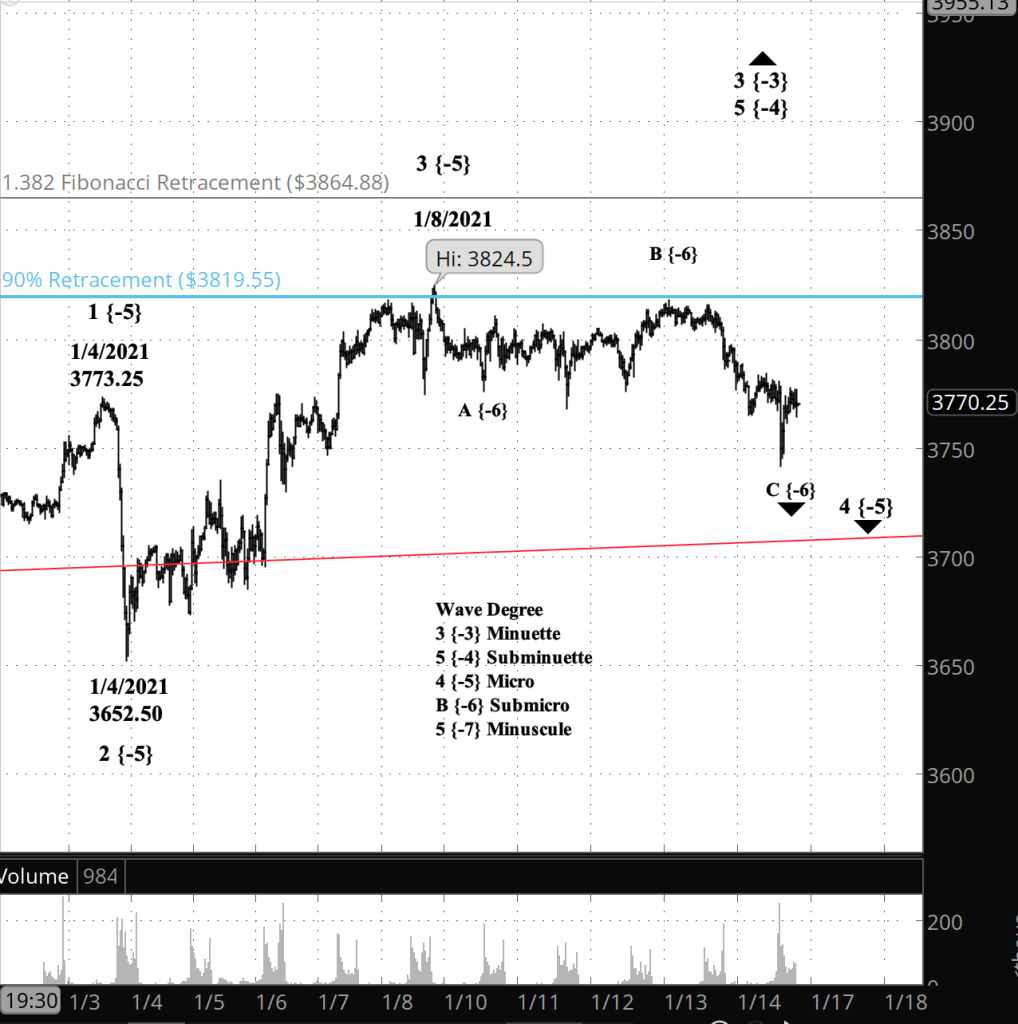
What does Elliott wave theory say? The present wave down is wave C of Submicro degree within wave 4 of Micro degree. The chart contains an anomaly, discussed yesterday, that casts doubt on the wave 4 analysis. Wave B failed to retrace 90% the preceding wave A, which is required under the Elliott wave rules for a Flat pattern.
I can’t see a clear alternative count to the Flat pattern. So perhaps instead of a Flat, the correction is a Zigzag, with 5-3-5 as the pattern within the A, B and C waves.
In any case, the magnitude of the fall suggests that Subminuette wave C has begun, making the question moot. Moving on.
The target for the parent wave, the 4th of Minuette degree, is to move back below the red line, which the upper boundary of a Diagonal Triangle that began in December 2018. So we’re looking at the lower 3700s as a start.
Learning and other resources. Elliott Wave International has long been the leading analytical house based on Elliott wave theory. They make available a number of free educational materials and other resources, in addition to their for-pay subscriptions.
I recommend two books, both by people associated with EWI.
First, Elliott Wave Principle by Robert Prechter and A.J. Frost is the book that, along with Prechter’s analyses, that created the revival of Elliott wave theory. I first read it in 1984, and it has had a profound influenced on my thinking about markets ever since.
Second, I’ve found Visual Guide to Elliott Wave Trading by Wayne Gorman and Jeffrey Kennedy, both of EWI, to be a useful book that relates Elliott wave theory to practical trading. The authors are hands-on Elliotticians, and for an active trader, that’s exactly what’s needed — less theory and more how-to. The first chapter of the book gives a very nice thumbnail run down of what Elliott wave theory is all about.
Terminology. Here are some links to information about some of the technical jargon I use.
Charts. On my charts, waves have a subscript showing the degree above or below the Intermediate degree. Here are the subscripts and the degree each represents:
- {+3} Supercycle
- {+2} Cycle
- {+1} Primary
- No subscript: Intermediate
- {-1} Minor
- {-2} Minute
- {-3} Minuette
By Tim Bovee, Portland, Oregon, January 15, 2021
Disclaimer
Tim Bovee, Private Trader tracks the analysis and trades of a private trader for his own accounts. Nothing in this blog constitutes a recommendation to buy or sell stocks, options or any other financial instrument. The only purpose of this blog is to provide education and entertainment.
No trader is ever 100 percent successful in his or her trades. Trading in the stock and option markets is risky and uncertain. Each trader must make trading decisions for his or her own account, and take responsibility for the consequences.
License
All content on Tim Bovee, Private Trader by Timothy K. Bovee is licensed under a Creative Commons Attribution-ShareAlike 4.0 International License.
Based on a work at www.timbovee.com.

You must be logged in to post a comment.