9:52 a.m. New York time
Market holiday. Markets in the United States are closed today for the holiday honoring Martin Luther King. The S&P 500 E-mini futures were traded overnight in other countries.
What’s happening now? The S&P 500 E-mini futures reversed at 3740.50 in overnight trading on January 17 after a decline that began on January 14 from 3817.75.
What does it mean? The reversal marks the start of a final uptrend within the larger rise that began October 30 from 3225.
What is the alternative? The rise that began overnight might be a separator between two corrective patterns, which is called a compound correction. It could also be that the downtrend that began January 14 is still in progress.
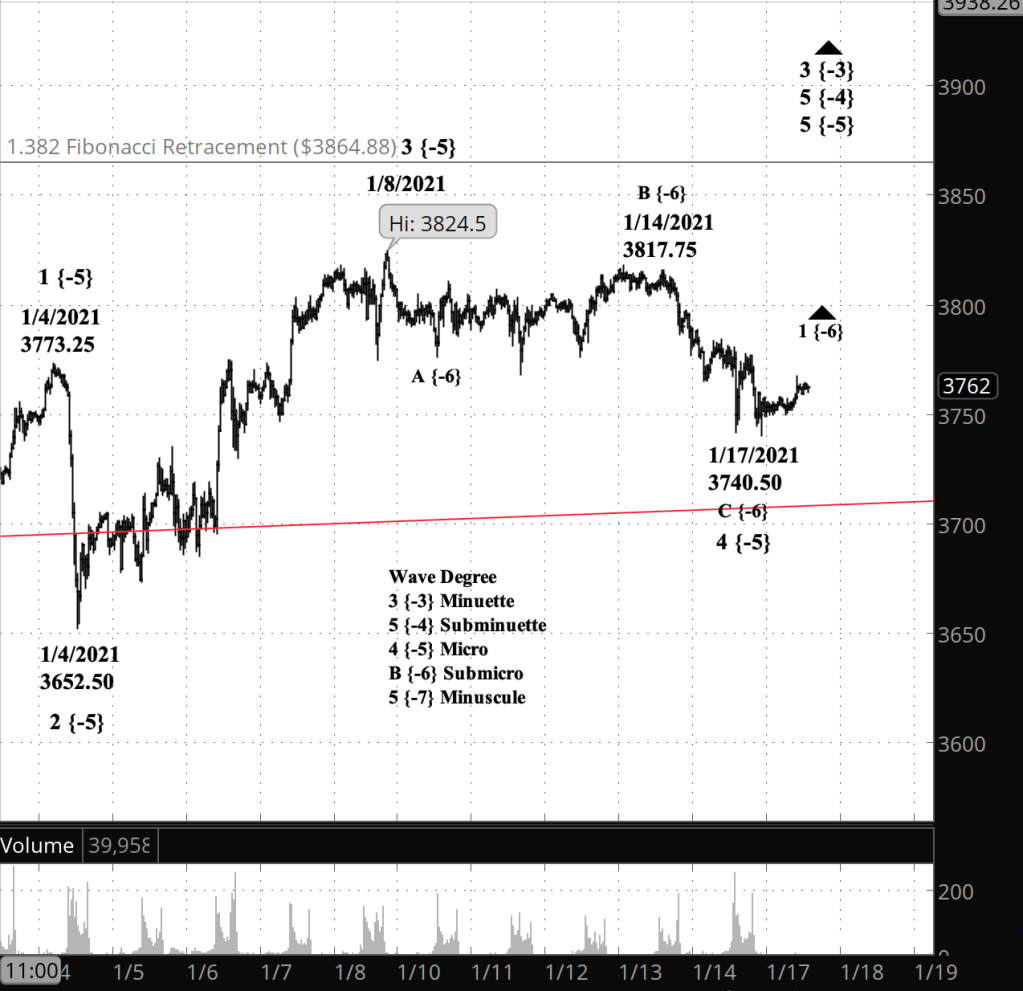
What does Elliott wave theory say? The large uptrend that began October 30 is wave 3 of Minuette degree. By my principle count, the reversal overnight marked the end of wave C of Submicro degree within wave 4 of Micro degree within wave 5 of Subminuette degree. It is the beginning of wave 5 of Micro degree.
An alternative count sees the correction as developing into a compound structure. Last night’s reversal under this view marks the beginning of wave X of Submicro degree, which will separate the A-B-C pattern just completed from another, not yet visible corrective pattern.
I’ve marked the chart as though the overnight low was indeed an end to Submicro C, but in fact it could still be underway. If that’s the case, then the down-pointing arrow that had appeared the chart’s “C {-6}” label will need to be restored, and likewise on the “4 {-5}” label.
My trading strategy. The next options entry period under my rules begins on January 26 and lasts through February 9, with February 2 being the midpoint, 45 days before expiration on March 19.
Learning and other resources. Elliott Wave International has long been the leading analytical house based on Elliott wave theory. They make available a number of free educational materials and other resources, in addition to their for-pay subscriptions.
I recommend two books, both by people associated with EWI.
First, Elliott Wave Principle by Robert Prechter and A.J. Frost is the book that, along with Prechter’s analyses, that created the revival of Elliott wave theory. I first read it in 1984, and it has had a profound influenced on my thinking about markets ever since.
Second, I’ve found Visual Guide to Elliott Wave Trading by Wayne Gorman and Jeffrey Kennedy, both of EWI, to be a useful book that relates Elliott wave theory to practical trading. The authors are hands-on Elliotticians, and for an active trader, that’s exactly what’s needed — less theory and more how-to. The first chapter of the book gives a very nice thumbnail run down of what Elliott wave theory is all about.
Terminology. Here are some links to information about some of the technical jargon I use.
Charts. On my charts, waves have a subscript showing the degree above or below the Intermediate degree. Here are the subscripts and the degree each represents:
- {+3} Supercycle
- {+2} Cycle
- {+1} Primary
- No subscript: Intermediate
- {-1} Minor
- {-2} Minute
- {-3} Minuette
By Tim Bovee, Portland, Oregon, January 18, 2021
Disclaimer
Tim Bovee, Private Trader tracks the analysis and trades of a private trader for his own accounts. Nothing in this blog constitutes a recommendation to buy or sell stocks, options or any other financial instrument. The only purpose of this blog is to provide education and entertainment.
No trader is ever 100 percent successful in his or her trades. Trading in the stock and option markets is risky and uncertain. Each trader must make trading decisions for his or her own account, and take responsibility for the consequences.
License
All content on Tim Bovee, Private Trader by Timothy K. Bovee is licensed under a Creative Commons Attribution-ShareAlike 4.0 International License.
Based on a work at www.timbovee.com.

You must be logged in to post a comment.