3:30 p.m. New York time
Half an hour before the closing bell. The S&P 500 climbed midway through the session, around noon, and then fluctuated in a sideways range as the closing bell approached. I’ve updated the chart below.
9:40 a.m. New York time
What’s happening now? The S&P 500 E-mini futures continued to decline overnight and has retraced 38.2% of the previous rise since January 17. That level is a Fibonacci percentage, one of several points where reversals are common. And indeed, as the opening sounded, the price rose a bit. (I’ve superimposed a Fibonacci grid, in red.)
What does it mean? The decline has been large enough to persuade me that the high of 3859.75 on January 21 is indeed the end of the rise and the beginning of a decline, which was my principle analysis in yesterday’s post. The decline could go further, but if I squint my eyes, the correction internally appears to have traced three waves and so has met the minimum requirements for a correction. However, the internal waves seem overly small to me, so my expectation is that there will be more downside.
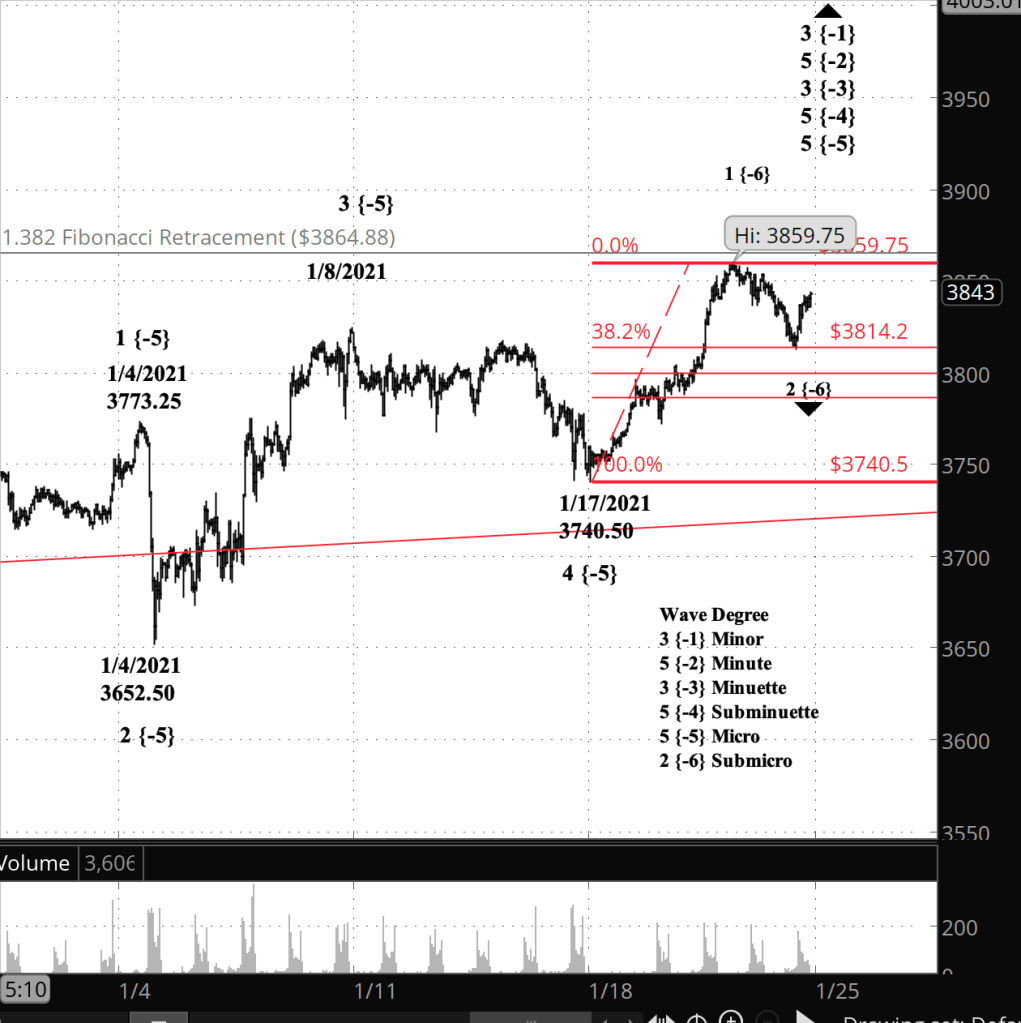
What does Elliott wave theory say? The decline, beginning on January 21 from 3859.75, is wave 2 of Submicro degree. It will be followed by a wave 3 rise to higher highs, then a shallow correction followed by a 5th wave push up even higher. Submicro 5’s completion will mark the end of wave 5 of Micro degree and Subminuette degree, and wave 3 of Minuette degree.
Learning and other resources. Elliott Wave International has long been the leading analytical house based on Elliott wave theory. They make available a number of free educational materials and other resources, in addition to their for-pay subscriptions.
I recommend two books, both by people associated with EWI.
First, Elliott Wave Principle by Robert Prechter and A.J. Frost is the book that, along with Prechter’s analyses, that created the revival of Elliott wave theory. I first read it in 1984, and it has had a profound influenced on my thinking about markets ever since.
Second, I’ve found Visual Guide to Elliott Wave Trading by Wayne Gorman and Jeffrey Kennedy, both of EWI, to be a useful book that relates Elliott wave theory to practical trading. The authors are hands-on Elliotticians, and for an active trader, that’s exactly what’s needed — less theory and more how-to. The first chapter of the book gives a very nice thumbnail run down of what Elliott wave theory is all about.
Terminology. Here are some links to information about some of the technical jargon I use.
Charts. On my charts, waves have a subscript showing the degree above or below the Intermediate degree. Here are the subscripts and the degree each represents:
- {+3} Supercycle
- {+2} Cycle
- {+1} Primary
- No subscript: Intermediate
- {-1} Minor
- {-2} Minute
- {-3} Minuette
- {-4} Subminuette
- {-5} Micro
- {-6} Submicro
By Tim Bovee, Portland, Oregon, January xx, 2021
Disclaimer
Tim Bovee, Private Trader tracks the analysis and trades of a private trader for his own accounts. Nothing in this blog constitutes a recommendation to buy or sell stocks, options or any other financial instrument. The only purpose of this blog is to provide education and entertainment.
No trader is ever 100 percent successful in his or her trades. Trading in the stock and option markets is risky and uncertain. Each trader must make trading decisions for his or her own account, and take responsibility for the consequences.
License
All content on Tim Bovee, Private Trader by Timothy K. Bovee is licensed under a Creative Commons Attribution-ShareAlike 4.0 International License.
Based on a work at www.timbovee.com.

You must be logged in to post a comment.