3 p.m. New York time
An hour before the market close. The S&P 500 rapidly dropped during the day to the 61.8% Fibonacci retracement level and then reversed. I’ve updated the chart below, marking the day’s decline as wave C of Miniscule degree, possibly culminating the 2nd wave correction of Submicro degree. Cautionary note: The rise following Miniscule wave C has yet to set a higher high and so cannot yet be labeled as the beginning of wave 3 of Submicro degree.
10:05 a.m. New York time
What’s happening now? The S&P 500 E-mini futures rose overnight but remained below the January 21 peak of 3859.75 in the middle wave of a three-wave a correction of the rise since January 17.
What does it mean? Prior to the rise, the price declined from the peak to a Fibonacci level, 38.2%. The rise retraced nearly all of the decline. It will be followed by another decline, perhaps down to the Fibonacci 50% or 68.8% retracement levels, the two lines below 31.8% on the red Fibonacci grid.
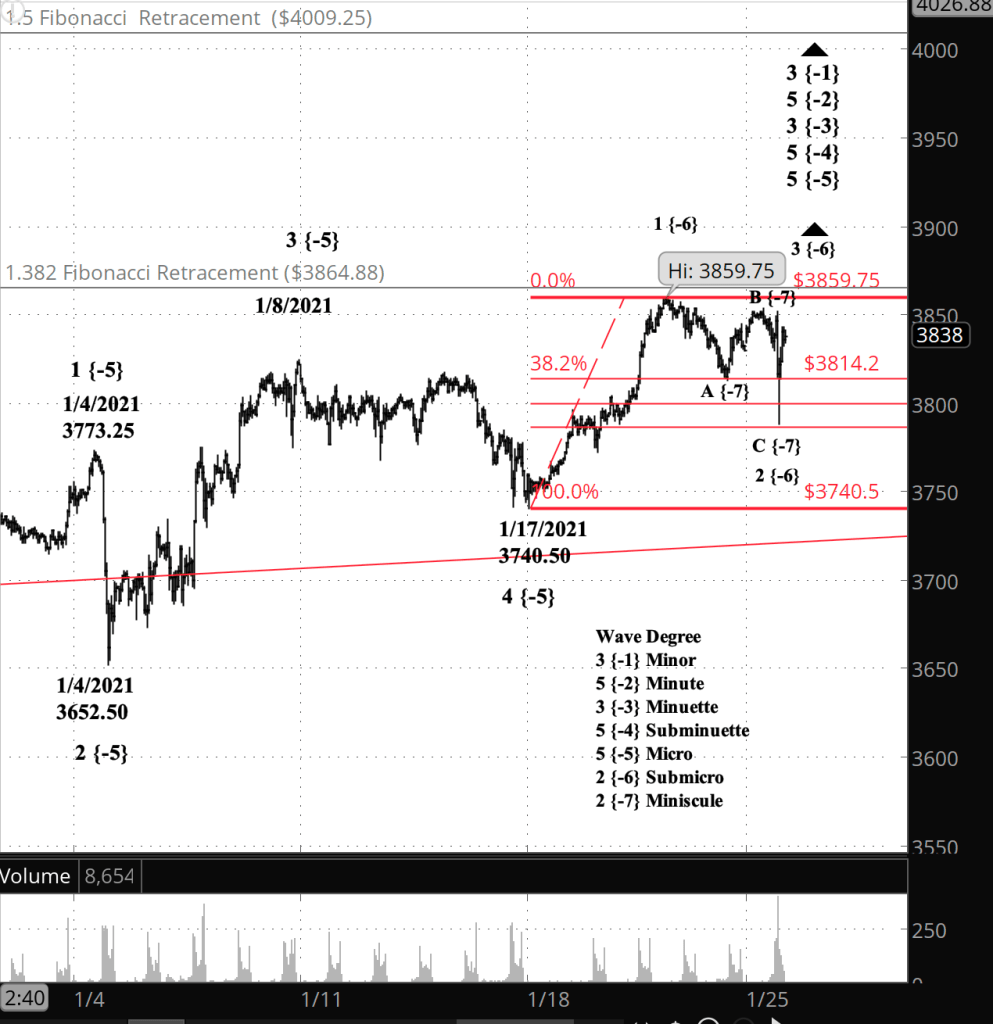
What does Elliott wave theory say? The price movement since last week’s peak has taken the form of a Zigzag, a corrective wave: wave A of Miniscule degree with five subwaves and wave B with three subwaves. The subsequent decline, Miniscule wave C, will have five subwaves. All of this is happening within wave 2 of Submicro degree. We’re looking at very small movements here.
Once wave C is complete, there are two alternatives. Usually for 2nd waves, a Zigzag will complete the correction and the market will rise to a new high, in this case as wave 3 of Submicro degree. A correction can also take a compound form, with two corrective patterns back to back separated by an X wave, which would be rising in this case. My opinion is that compounding is unlikely, but that’s not the same as impossible. If the future rise after Miniscule C reaches a new high, then it’s part of Submicro wave 3. If it reverses without reaching a new high, then it’s a Miniscule degree X wave.
The two gray Fibonacci levels on the chart are possible price targets for Submicro wave 3. No guarantees, but waves often reverse at Fibonacci levels.
The small movements discussed above are part of an upward movement that began February 23, 2020. The full positioning of Miniuscule wave C would be that it is a subwave of wave 2 of Submicro degree within Micro wave 5 within Subminuette 5 within Minuette 3 within Minute 5 within Minor 3.
My trading strategy. My next options trading window begins Tuesday, January 26 (that’s tomorrow) and will remain open until February 9.
Learning and other resources. Elliott Wave International has long been the leading analytical house based on Elliott wave theory. They make available a number of free educational materials and other resources, in addition to their for-pay subscriptions.
I recommend two books, both by people associated with EWI.
First, Elliott Wave Principle by Robert Prechter and A.J. Frost is the book that, along with Prechter’s analyses, that created the revival of Elliott wave theory. I first read it in 1984, and it has had a profound influenced on my thinking about markets ever since.
Second, I’ve found Visual Guide to Elliott Wave Trading by Wayne Gorman and Jeffrey Kennedy, both of EWI, to be a useful book that relates Elliott wave theory to practical trading. The authors are hands-on Elliotticians, and for an active trader, that’s exactly what’s needed — less theory and more how-to. The first chapter of the book gives a very nice thumbnail run down of what Elliott wave theory is all about.
Terminology. Here are some links to information about some of the technical jargon I use.
Charts. On my charts, waves have a subscript showing the degree above or below the Intermediate degree. Here are the subscripts and the degree each represents:
- {+3} Supercycle
- {+2} Cycle
- {+1} Primary
- No subscript: Intermediate
- {-1} Minor
- {-2} Minute
- {-3} Minuette
- {-4} Subminuette
- {-5} Micro
- {-6} Submicro
By Tim Bovee, Portland, Oregon, January 25, 2021
Disclaimer
Tim Bovee, Private Trader tracks the analysis and trades of a private trader for his own accounts. Nothing in this blog constitutes a recommendation to buy or sell stocks, options or any other financial instrument. The only purpose of this blog is to provide education and entertainment.
No trader is ever 100 percent successful in his or her trades. Trading in the stock and option markets is risky and uncertain. Each trader must make trading decisions for his or her own account, and take responsibility for the consequences.
License
All content on Tim Bovee, Private Trader by Timothy K. Bovee is licensed under a Creative Commons Attribution-ShareAlike 4.0 International License.
Based on a work at www.timbovee.com.

You must be logged in to post a comment.