Half an hour before the closing bell. The S&P 500 remains close the the 1.382 retracement level of the rise since February 23. On the E-mini futures chart I count the upward movement as being in a 3rd wave internal to wave 3 of Submicro degree. Here’s a big-picture chart showing three Fibonacci retracement price targets. The red lines are a long-running Diagonal Triangle I’ve also updated the near-term chart, below, with the red line showing the upper boundary of the triangle.

9:40 a.m. New York time
What’s happening now? The S&P 500 E-mini futures before the opening bell came with half a point of the high set of 3859.75 set on January 20. As the bell rang, the price moved above that level to a new high.
What does it mean? The move above the January 20 high confirms that the low-level correction ended on January 25 and a new movement to the upside is underway. It has hit the lowest Fibonacci target.
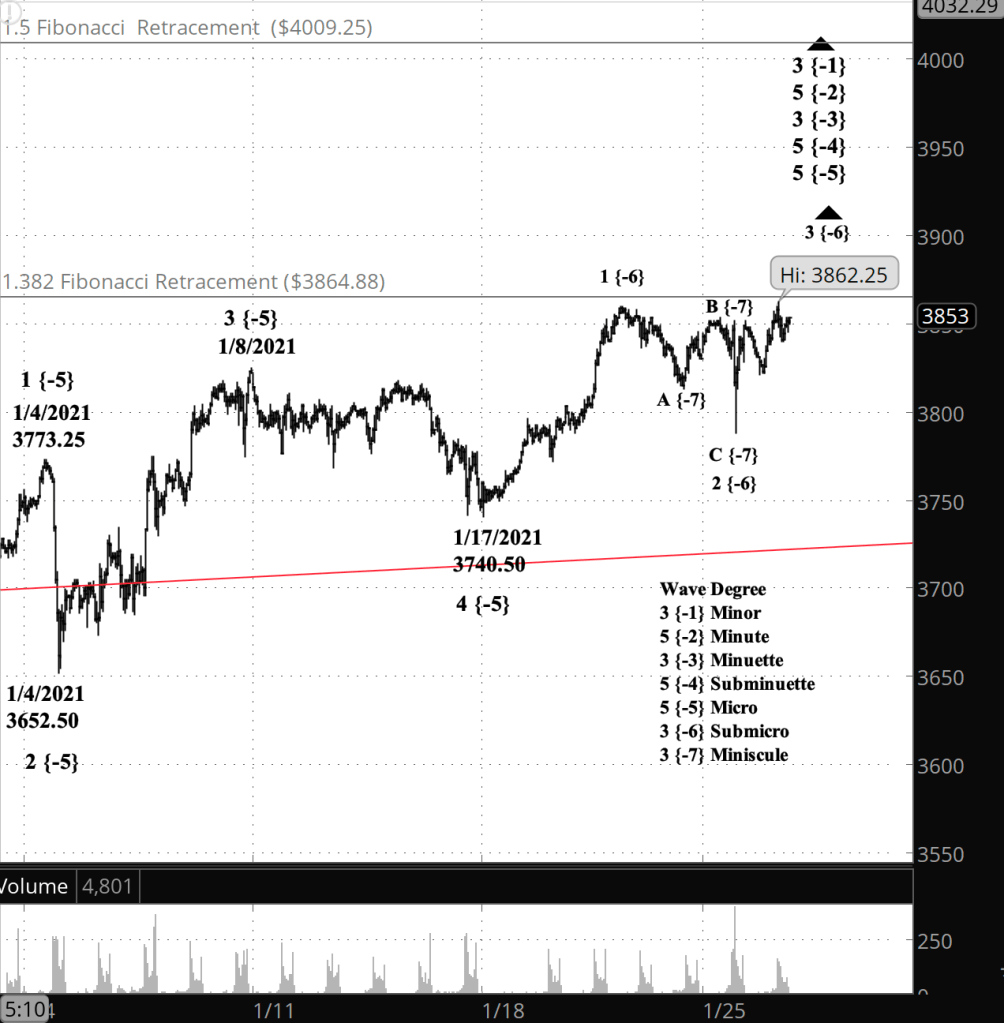
What does Elliott wave theory say? My principle count sees the rise as wave 3 of Submicro degree. Internally, Submicro 3 appears to be in its 3rd wave of Minuscule degree. Third waves are usually the strongest of the three waves that move in the direction of a trend. This is all happening, from smaller movements to larger, within wave 5 of Micro degree within wave 5 of Subminuette degree within wave 3 of Minuette degree within wave 5 of Minute degree within wave 3 of Minor degree.
My trading strategy. Today is the first day for entering positions using options that expire March 19. The enter period will run through February 9, within the midpoint — the ideal entry date — being February 2.
Learning and other resources. Elliott Wave International has long been the leading analytical house based on Elliott wave theory. They make available a number of free educational materials and other resources, in addition to their for-pay subscriptions.
I recommend two books, both by people associated with EWI.
First, Elliott Wave Principle by Robert Prechter and A.J. Frost is the book that, along with Prechter’s analyses, that created the revival of Elliott wave theory. I first read it in 1984, and it has had a profound influenced on my thinking about markets ever since.
Second, I’ve found Visual Guide to Elliott Wave Trading by Wayne Gorman and Jeffrey Kennedy, both of EWI, to be a useful book that relates Elliott wave theory to practical trading. The authors are hands-on Elliotticians, and for an active trader, that’s exactly what’s needed — less theory and more how-to. The first chapter of the book gives a very nice thumbnail run down of what Elliott wave theory is all about.
Terminology. Here are some links to information about some of the technical jargon I use.
Charts. On my charts, waves have a subscript showing the degree above or below the Intermediate degree. Here are the subscripts and the degree each represents:
- {+3} Supercycle
- {+2} Cycle
- {+1} Primary
- No subscript: Intermediate
- {-1} Minor
- {-2} Minute
- {-3} Minuette
- {-4} Subminuette
- {-5} Micro
- {-6} Submicro
- {-7} Minuscule
By Tim Bovee, Portland, Oregon, January 26, 2021
Disclaimer
Tim Bovee, Private Trader tracks the analysis and trades of a private trader for his own accounts. Nothing in this blog constitutes a recommendation to buy or sell stocks, options or any other financial instrument. The only purpose of this blog is to provide education and entertainment.
No trader is ever 100 percent successful in his or her trades. Trading in the stock and option markets is risky and uncertain. Each trader must make trading decisions for his or her own account, and take responsibility for the consequences.
License
All content on Tim Bovee, Private Trader by Timothy K. Bovee is licensed under a Creative Commons Attribution-ShareAlike 4.0 International License.
Based on a work at www.timbovee.com.

You must be logged in to post a comment.