3:30 p.m. New York time
Half an hour before the closing bell. The S&P 500 E-mini futures from last night set lower highs for 10 hours, set one (barely) higher high in the next hour, and then resumed lower highs for the next three hours, another higher high in one hour, and then two hours of lower highs to the present moment. Which, all-in-all, could be seen as a weakening of the decline, perhaps signaling that a reversal is near. I’ve updated the chart below.
9:45 a.m. New York time
What’s happening now? The S&P 500 E-mini futures dropped sharply from yesterday’s high of 3862.25, reach 3775.25 in early trading.
What does it mean? The decline forces a reassessment of yesterday’s analysis. Under the new labelling, the correction that began January 17 is still underway. I set out my reasoning in the Elliott wave theory section below.
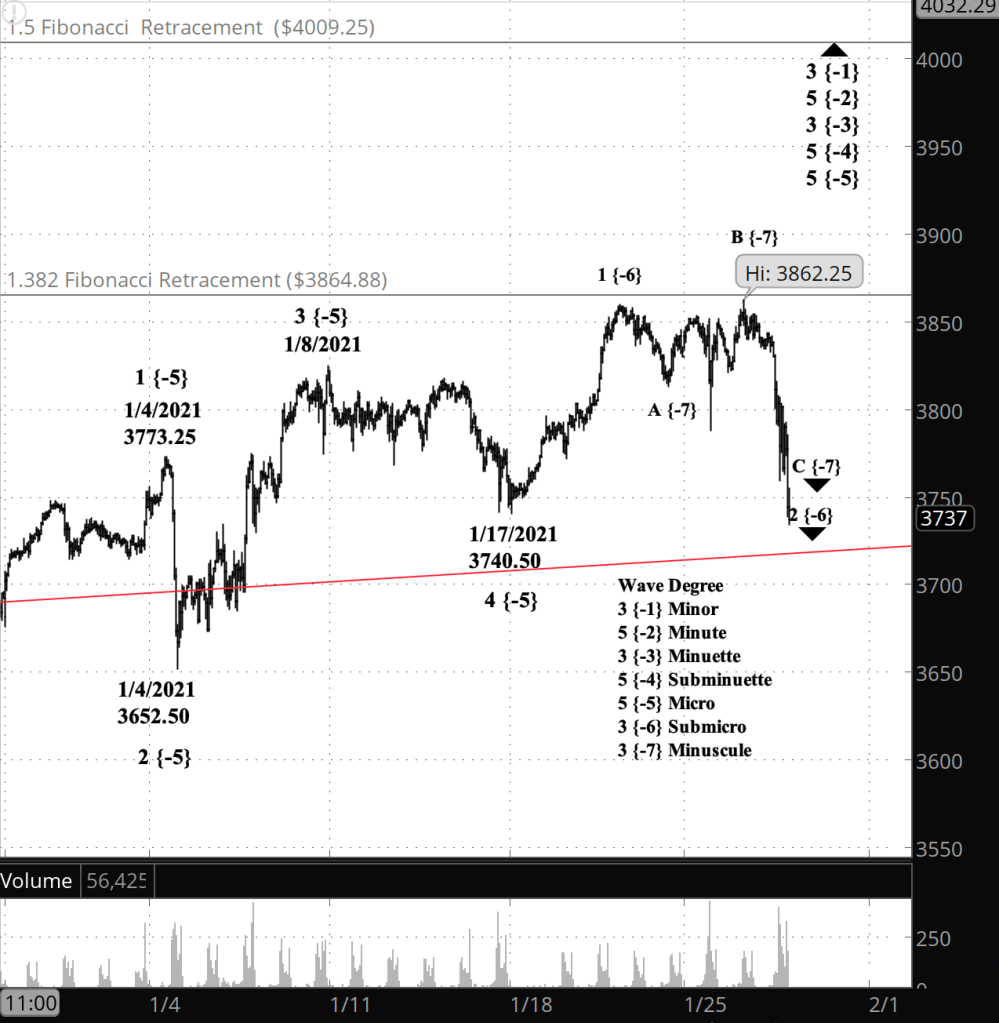
What does Elliott wave theory say? The reassessment suggests that the A-B-C waves described yesterday as being of the Minuscule degree are in fact one degree lower, at the Subminuscule level, and that the parent form — wave 2 of Subminuette degree — is still underway. The rest of the analysis remains unchanged: The end of Minuscule wave C will be followed by one of two options: 1) Wave C will concluded wave 2 of Subminuette degree and will be followed by a rise to new highs as Subminuette wave 3. Or, 2) wave C will be followed rise that will fall short of new highs, a separator wave between two correction patterns in a compound structure as Subminuette wave 2 continues. I consider the second options to be unlikely; compound structures are more often seen in 4th waves.
Learning and other resources. Elliott Wave International has long been the leading analytical house based on Elliott wave theory. They make available a number of free educational materials and other resources, in addition to their for-pay subscriptions.
I recommend two books, both by people associated with EWI.
First, Elliott Wave Principle by Robert Prechter and A.J. Frost is the book that, along with Prechter’s analyses, that created the revival of Elliott wave theory. I first read it in 1984, and it has had a profound influenced on my thinking about markets ever since.
Second, I’ve found Visual Guide to Elliott Wave Trading by Wayne Gorman and Jeffrey Kennedy, both of EWI, to be a useful book that relates Elliott wave theory to practical trading. The authors are hands-on Elliotticians, and for an active trader, that’s exactly what’s needed — less theory and more how-to. The first chapter of the book gives a very nice thumbnail run down of what Elliott wave theory is all about.
Terminology. Here are some links to information about some of the technical jargon I use.
Charts. On my charts, waves have a subscript showing the degree above or below the Intermediate degree. Here are the subscripts and the degree each represents:
- {+3} Supercycle
- {+2} Cycle
- {+1} Primary
- No subscript: Intermediate
- {-1} Minor
- {-2} Minute
- {-3} Minuette
- {-4} Subminuette
- {-5} Micro
- {-6} Submicro
- {-7} Minuscule
By Tim Bovee, Portland, Oregon, January 27, 2021
Disclaimer
Tim Bovee, Private Trader tracks the analysis and trades of a private trader for his own accounts. Nothing in this blog constitutes a recommendation to buy or sell stocks, options or any other financial instrument. The only purpose of this blog is to provide education and entertainment.
No trader is ever 100 percent successful in his or her trades. Trading in the stock and option markets is risky and uncertain. Each trader must make trading decisions for his or her own account, and take responsibility for the consequences.
License
All content on Tim Bovee, Private Trader by Timothy K. Bovee is licensed under a Creative Commons Attribution-ShareAlike 4.0 International License.
Based on a work at www.timbovee.com.

You must be logged in to post a comment.