12:05 p.m. New York time
Elliott wave analysis is based on the premise that stock prices represent the thinking of groups of people, which in turn mirrors the public mood. The pattern of a stock chart represents the stereotypical ways in which that mood fluctuates. The great practitioner of Elliott wave analysis, Robert Prechter, has characterized it as herding behavior.
The Great /r WallStreetBets Short Squeeze on GME, which sent the gaming company stock soaring by orders of magnitude, has reversed. The pattern of the rise fits perfectly into an uptrending Elliott wave pattern. Wave 5, of course, is the end of the rise. The ensuing movement to the downside is either the beginning of a new downtrend, or a correction within a continuing uptrend. An article on what happened may be found here. And here’s a chart showing the analysis. (I have no idea what the degree of the waves are, so I’ve used the wave numbers without a subscript.)
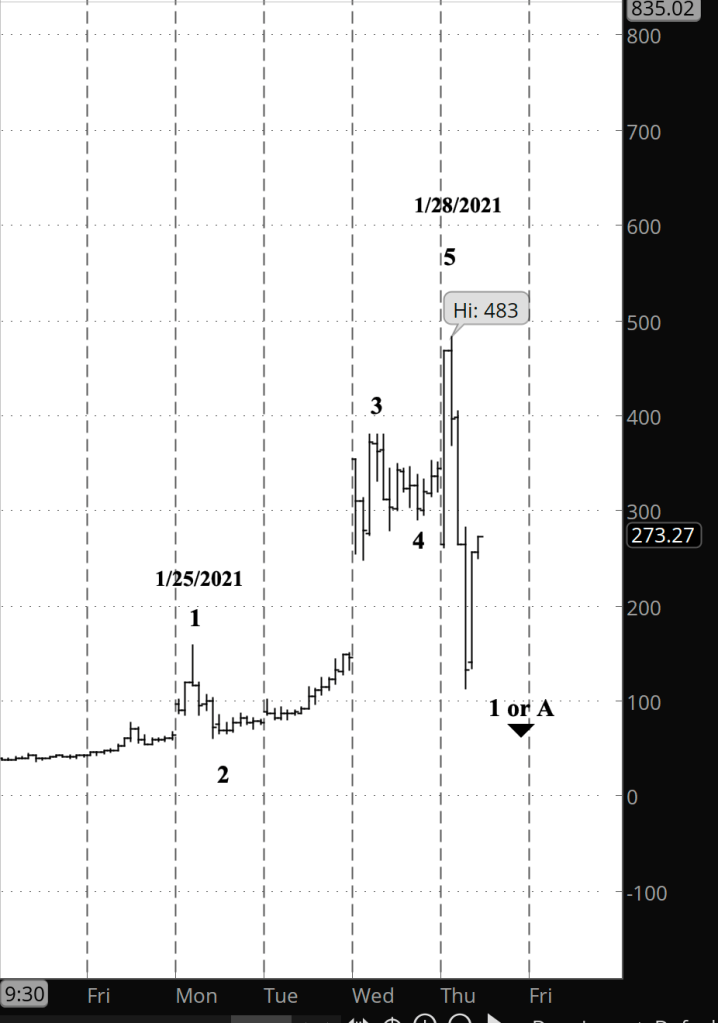
I’m fascinated by normality of the chart. This rise was the equivalent of a street action, group protest against the short-seller of hedge funds. It has been aptly described as a popular rebellion of private traders against the rich and powerful. And yet, this revolutionary act followed the same rules as a rise in AAPL, TSLA or the S&P 500: Three waves in the direction of the trend, with the middle wave — the 3rd wave — not being the shortest of the three, and two counter-trend corrections. It all played out in six days, with the price rising to 11 times the starting price before dropping after financial companies blocked GME stock purchases. And despite the rebellious motives behind the rise and the regulatory stomping on the brakes that end it, the chart followed the rules discovered in the 1930s by R.N. Elliott.
By Tim Bovee, Portland, Oregon, January 28, 2021
Learning and other resources. Elliott Wave International has long been the leading analytical house based on Elliott wave theory. They make available a number of free educational materials and other resources, in addition to their for-pay subscriptions.
I recommend two books, both by people associated with EWI.
First, Elliott Wave Principle by Robert Prechter and A.J. Frost is the book that, along with Prechter’s analyses, that created the revival of Elliott wave theory. I first read it in 1984, and it has had a profound influenced on my thinking about markets ever since.
Second, I’ve found Visual Guide to Elliott Wave Trading by Wayne Gorman and Jeffrey Kennedy, both of EWI, to be a useful book that relates Elliott wave theory to practical trading. The authors are hands-on Elliotticians, and for an active trader, that’s exactly what’s needed — less theory and more how-to. The first chapter of the book gives a very nice thumbnail run down of what Elliott wave theory is all about.
Terminology. Here are some links to information about some of the technical jargon I use.
Disclaimer
Tim Bovee, Private Trader tracks the analysis and trades of a private trader for his own accounts. Nothing in this blog constitutes a recommendation to buy or sell stocks, options or any other financial instrument. The only purpose of this blog is to provide education and entertainment.
No trader is ever 100 percent successful in his or her trades. Trading in the stock and option markets is risky and uncertain. Each trader must make trading decisions for his or her own account, and take responsibility for the consequences.
License
All content on Tim Bovee, Private Trader by Timothy K. Bovee is licensed under a Creative Commons Attribution-ShareAlike 4.0 International License.
Based on a work at www.timbovee.com.

[…] I’ve done a couple of analyses of GME, which has proven to be the subject of an epic street action, and one with far reaching consequences. Today’s analysis may be read here. And yesterday’s is here. […]
LikeLike
[…] I’ve done a couple of analyses of GME, which has proven to be the subject of an epic street action, and one with far reaching consequences. Today’s analysis may be read here. And yesterday’s is here. […]
LikeLike