2:50 p.m. New York time
I’ve done a couple of analyses of GME, which has proven to be the subject of an epic street action, and one with far reaching consequences. Today’s analysis may be read here. And yesterday’s is here.
The consequences, I suspect, will come in the form of new regulations. People speak of free markets, but the American stock, options and futures exchanges aren’t among them. They are highly regulated components of the country’s economy. So what form would new regulations take? One will probably be to take the index trading halts on falling indexes that came from the Crash of 1987 and apply them to individual stocks, limiting intra-day movements in both directions. Another might be some limits on short-selling, although as much as Elon Musk might wish it, short selling will surely not be abolished outright.
In any case, as reminiscent of Les Miserables as the /r/WallStreetBets Rebellion of 2021 was, the outcome will surely be the same. The Powers That Be will keep control. We can bet on that with 100% certainty.
2:25 p.m. New York time
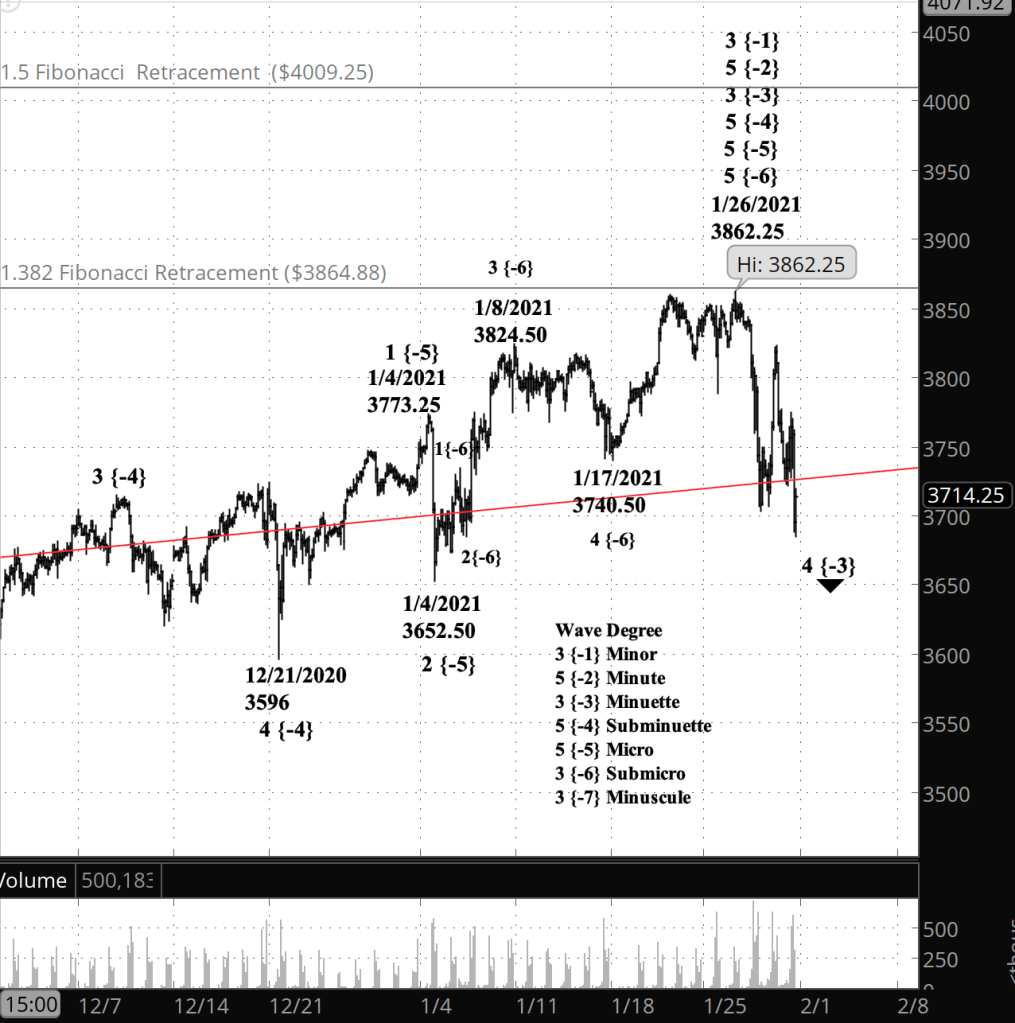
Revision of the count. Given the degree of decline today, I’ve done a complete reworking of the count. It pushes the Micro degree labels for waves 3 and 4 down to Submicro degree, treating the high of January 8 as the end of Submicro wave 3, the low of January 17 as the end of Submicro wave 4, and the high of January 26 as the end of Submicro wave 5.
That small-wave completion also cascades up to higher degrees, marking the end of (from smaller degree to larger) of Micro wave 5 within Subminuette wave 5 within Minuette wave 3. The decline from the January 26 high — 3862.25 on the E-mini futures and 3870.09 on the index — is the early stages of wave 4 of Minuette degree, a correction that, if it followed the typical 4th wave pattern, will be shallow rather than steep.
Here’s the revised chart.
10:10 a.m. New York time
What’s happening now? The S&P 500 E-mini futures continued to work their way upward in overnight trading in the middle stage of an uptrend that began December 21.
What does it mean? Completion of the middle stage, which began January 27, will be followed by a correction — most likely a shallow one — and then a push up to a new high. The end of that may be at one of the Fibonacci levels retracing the powerful February to March fall of last year. The 131.8% level, at 3864.88, has been touched, and the next one up is the 150.0% level at 4009.25
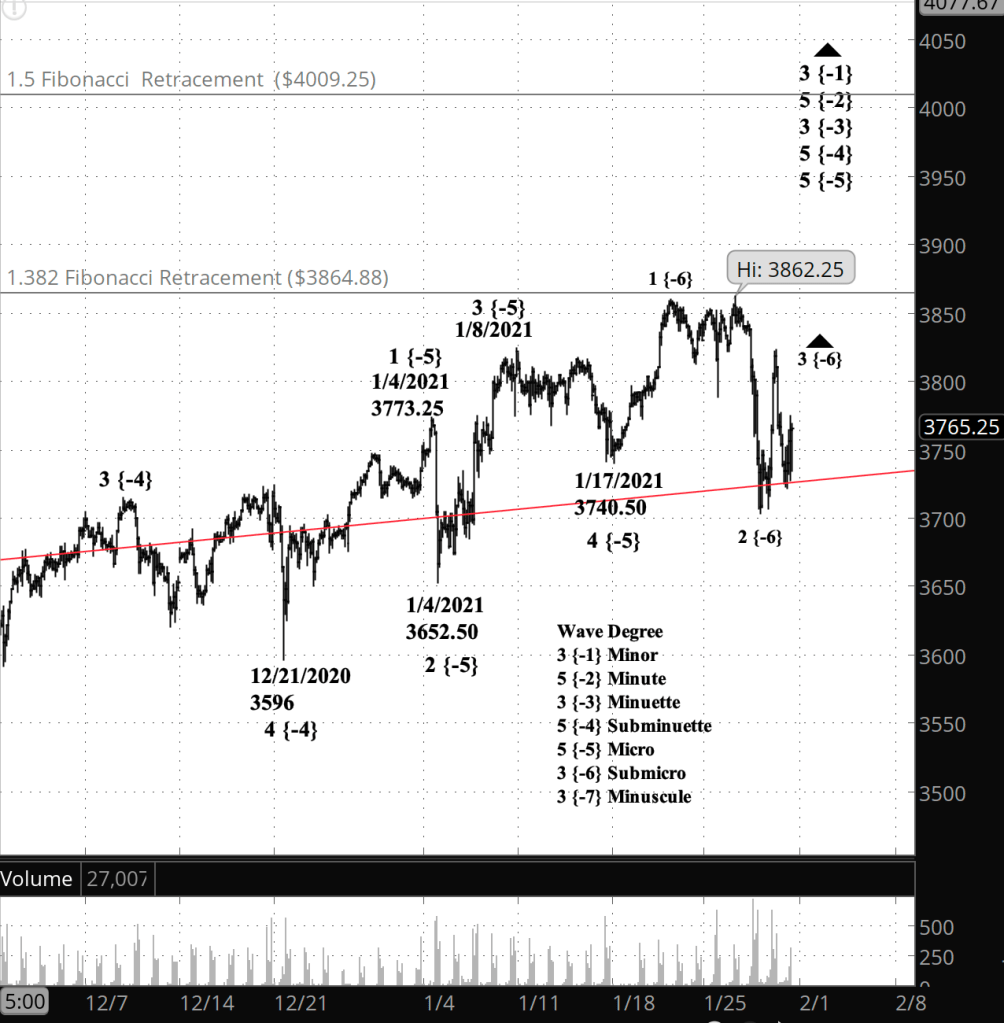
What does Elliott wave theory say? The present rise is wave 3 of Submicro degree, and internally I see it as being in having completed a subwave, 3 of Minuscule degree, in overnight trading and embarked on a corrective subwave, Minuscule 4. This is all within wave 5 of Micro, whose completion will cascade up the degrees and also mark the end of wave 3 of Minuette degree, which began November 12, 2020 from 3525.20
My trading strategy. The window is open for entering a position built from options expiring March 19. Under my rules I have until February 9 to enter, with February 2 — Tuesday of next week — being the ideal entry point.
Honestly, there are not a lot of great choices. My rules require an implied volatility rank (IVR) — a comparison of a stock’s implied volatility to its previous levels — of 25 or greater. I also tend to prefer exchange-traded funds (ETF) rather than having to navigate the drama of earnings announcements.
My ETF choices meeting that IVR requirement are SLV 66.2, IWM 33.1 and QQQ 30.7, GLD 28.0. The S&P 500 ETF, SPY, is below my minimum, at 24.0.
Learning and other resources. Elliott Wave International has long been the leading analytical house based on Elliott wave theory. They make available a number of free educational materials and other resources, in addition to their for-pay subscriptions.
I recommend two books, both by people associated with EWI.
First, Elliott Wave Principle by Robert Prechter and A.J. Frost is the book that, along with Prechter’s analyses, that created the revival of Elliott wave theory. I first read it in 1984, and it has had a profound influenced on my thinking about markets ever since.
Second, I’ve found Visual Guide to Elliott Wave Trading by Wayne Gorman and Jeffrey Kennedy, both of EWI, to be a useful book that relates Elliott wave theory to practical trading. The authors are hands-on Elliotticians, and for an active trader, that’s exactly what’s needed — less theory and more how-to. The first chapter of the book gives a very nice thumbnail run down of what Elliott wave theory is all about.
Terminology. Here are some links to information about some of the technical jargon I use.
Charts. On my charts, waves have a subscript showing the degree above or below the Intermediate degree. Here are the subscripts and the degree each represents:
- {+3} Supercycle
- {+2} Cycle
- {+1} Primary
- No subscript: Intermediate
- {-1} Minor
- {-2} Minute
- {-3} Minuette
- {-4} Subminuette
- {-5} Micro
- {-6} Submicro
- {-7} Minuscule
By Tim Bovee, Portland, Oregon, January 29, 2021
Disclaimer
Tim Bovee, Private Trader tracks the analysis and trades of a private trader for his own accounts. Nothing in this blog constitutes a recommendation to buy or sell stocks, options or any other financial instrument. The only purpose of this blog is to provide education and entertainment.
No trader is ever 100 percent successful in his or her trades. Trading in the stock and option markets is risky and uncertain. Each trader must make trading decisions for his or her own account, and take responsibility for the consequences.
License
All content on Tim Bovee, Private Trader by Timothy K. Bovee is licensed under a Creative Commons Attribution-ShareAlike 4.0 International License.
Based on a work at www.timbovee.com.

You must be logged in to post a comment.