An earlier version of this post, published prematurely, showed an incomplete analysis that differs significantly in its conclusions from this final version.
3:30 p.m. New York time
Half an hour before the closing bell. The S&P 500 rose to 3912.25 on the futures, two points below the overnight high. If it remains below that high, then the primary analysis prevails. If it moves above that high, then the alternative analysis prevails. I’ve updated the chart below.
10:20 a.m. New York time
What’s happening now? The S&P 500 E-mini futures stretched up to a higher high in overnight trading, 3913.25 on the futures and 3915.77 on the index.
What does it mean? I see the high as having completed the final wave of the five waves in a movement in the direction of the trend. The completion of the rise will cascade up the degrees and will initiate a significant deadline in price.
What are the alternatives? Market movements are often (usually?) ambiguous, and today’s new high is no exception. The final wave may be extending, leading to still higher highs before it is complete.
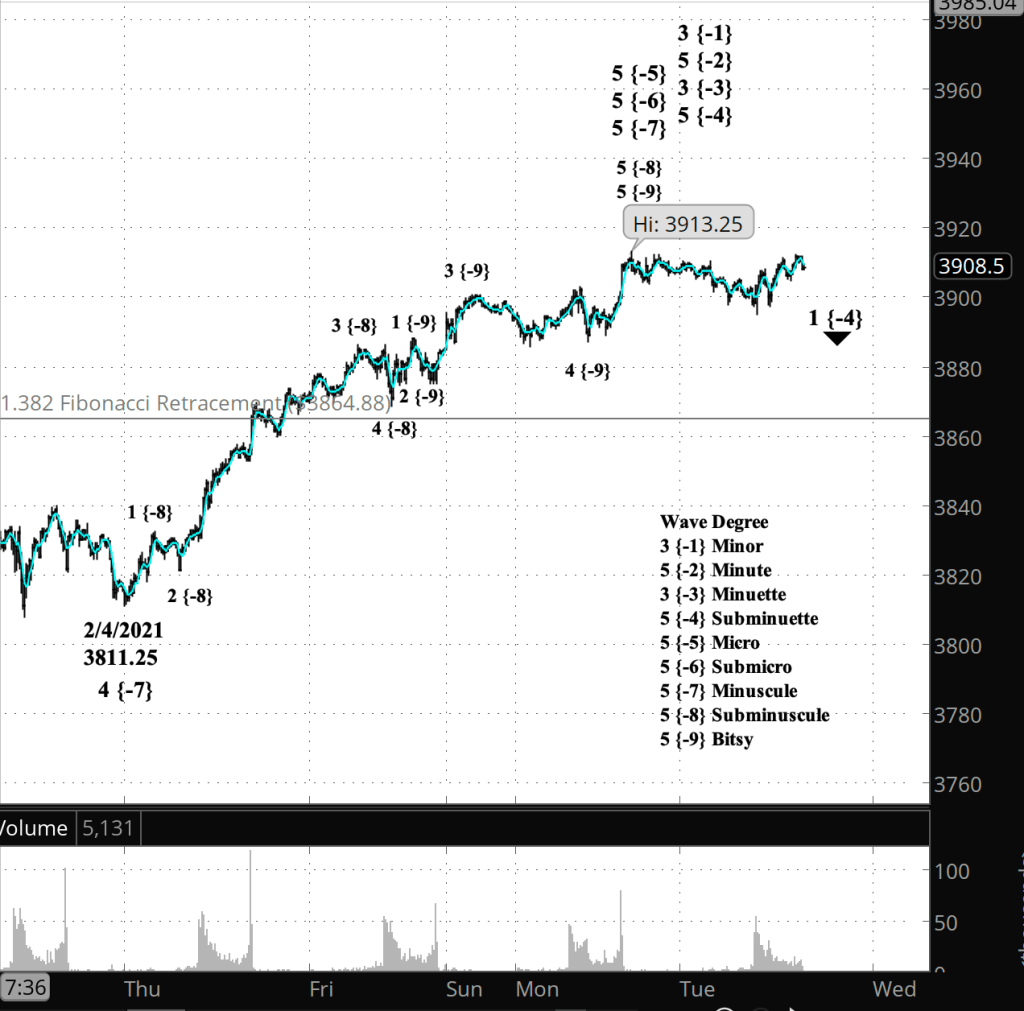
What does Elliott wave theory say? I’ve superimposed a 4-day simple moving average on the chart to smooth out the fluctuations so as to make it easier to pick out the waves of Subminuscule degree, marked with the {-8} subscript on the chart. I’ve had to make up a name for waves smaller than Subminuscule and have chosen “Bitsy”, as in the children’s word “itsy-bitsy”. By my count, the overnight high completes wave 5 of Bitsy degree within wave 5 of Subminuscule degree. Under my principle count, the decline that follows is the tentative beginning, not of a correction, but of a new downtrend.
The completion of Bitsy 5 within Subminuscule 5 will trigger completion of the rise all the way up to Subminuette degree, and will be completion of wave 3 of Minuette degree.
Learning and other resources. Elliott Wave International has long been the leading analytical house based on Elliott wave theory. They make available a number of free educational materials and other resources, in addition to their for-pay subscriptions.
I recommend two books, both by people associated with EWI.
First, Elliott Wave Principle by Robert Prechter and A.J. Frost is the book that, along with Prechter’s analyses, that created the revival of Elliott wave theory. I first read it in 1984, and it has had a profound influenced on my thinking about markets ever since.
Second, I’ve found Visual Guide to Elliott Wave Trading by Wayne Gorman and Jeffrey Kennedy, both of EWI, to be a useful book that relates Elliott wave theory to practical trading. The authors are hands-on Elliotticians, and for an active trader, that’s exactly what’s needed — less theory and more how-to. The first chapter of the book gives a very nice thumbnail run down of what Elliott wave theory is all about.
Terminology. Here are some links to information about some of the technical jargon I use.
Charts. On my charts, waves have a subscript showing the degree above or below the Intermediate degree. Here are the subscripts and the degree each represents:
- {+3} Supercycle
- {+2} Cycle
- {+1} Primary
- No subscript: Intermediate
- {-1} Minor
- {-2} Minute
- {-3} Minuette
- {-4} Subminuette
- {-5} Micro
- {-6} Submicro
- {-7} Minuscule
By Tim Bovee, Portland, Oregon, February 9, 2021
Disclaimer
Tim Bovee, Private Trader tracks the analysis and trades of a private trader for his own accounts. Nothing in this blog constitutes a recommendation to buy or sell stocks, options or any other financial instrument. The only purpose of this blog is to provide education and entertainment.
No trader is ever 100 percent successful in his or her trades. Trading in the stock and option markets is risky and uncertain. Each trader must make trading decisions for his or her own account, and take responsibility for the consequences.
License
All content on Tim Bovee, Private Trader by Timothy K. Bovee is licensed under a Creative Commons Attribution-ShareAlike 4.0 International License.
Based on a work at www.timbovee.com.

[…] mean? The rise from January 31 continued after yesterday’s pullback, a scenario described in yesterday’s alternate analysis. When the rise is complete, the S&P 500 will reverse into a downtrend that will eventually […]
LikeLike