3:30 p.m. New York time
Half an hour before the closing bell. The S&P 500 fell quickly in the morning, falling 50 points to 3878.25 in 15 minutes of trading. That movement strengthens the case for the principle analysis. Chart updated.
9:40 a.m. New York time
What’s happening now? The S&P 500 E-mini futures shot up to a higher high of 3928.50 in the hour before the opening bell. The price had moved above yesterday’s high in a sideways movement but rose to that new high in four minutes of trading before the index opened.
What does it mean? The rise from January 31 continued after yesterday’s pullback, a scenario described in yesterday’s alternate analysis. When the rise is complete, the S&P 500 will reverse into a downtrend that will eventually drain the optimism from the marketplace. The brevity of the upward at 8:30 a.m. New York time suggests the possibility of an exhaustion move, a sudden move in the direction of the trend that marks its end.
What are the alternatives? The principle and alternate analyses are the same as yesterday. Principle: The higher high marks the end of the upward trend. Secondary: A retracement before the upward trend continues.
(Once again the WordPress editor refuses to size charts properly. So, big chart.)
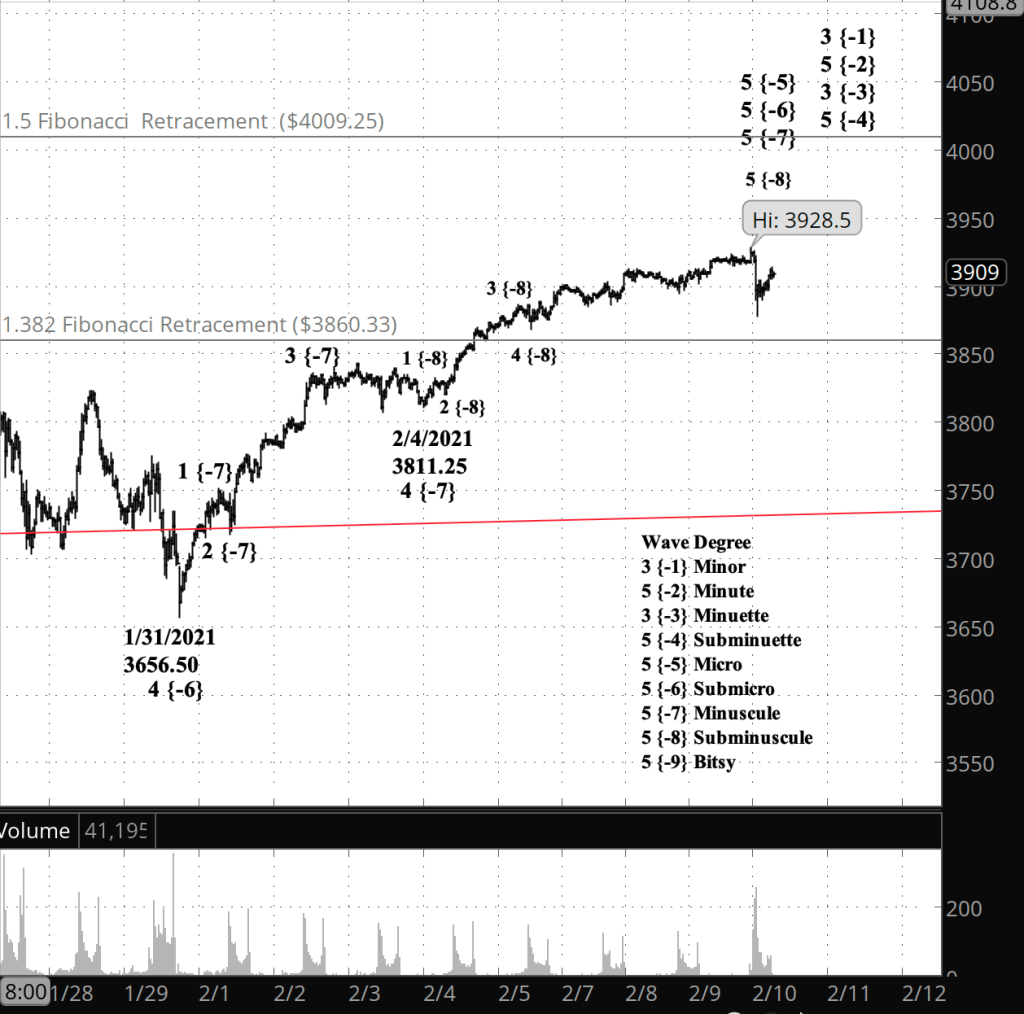
What does Elliott wave theory say? The 8:30 a.m. spike under my principle analysis completes wave 5 of Subminuscule degree within wave 5 of Minuscule degree, and 5th waves up to Minute degree, which is one degree lower than wave 3 of Minor degree. However, there is nothing in Elliott that guarantees that Subminuscule 5 is complete, and also doesn’t guarantee that it’s not yet complete. Ambiguity rules.
Learning and other resources. Elliott Wave International has long been the leading analytical house based on Elliott wave theory. They make available a number of free educational materials and other resources, in addition to their for-pay subscriptions.
I recommend two books, both by people associated with EWI.
First, Elliott Wave Principle by Robert Prechter and A.J. Frost is the book that, along with Prechter’s analyses, that created the revival of Elliott wave theory. I first read it in 1984, and it has had a profound influenced on my thinking about markets ever since.
Second, I’ve found Visual Guide to Elliott Wave Trading by Wayne Gorman and Jeffrey Kennedy, both of EWI, to be a useful book that relates Elliott wave theory to practical trading. The authors are hands-on Elliotticians, and for an active trader, that’s exactly what’s needed — less theory and more how-to. The first chapter of the book gives a very nice thumbnail run down of what Elliott wave theory is all about.
Terminology. Here are some links to information about some of the technical jargon I use.
Charts. On my charts, waves have a subscript showing the degree above or below the Intermediate degree. Here are the subscripts and the degree each represents:
- {+3} Supercycle
- {+2} Cycle
- {+1} Primary
- No subscript: Intermediate
- {-1} Minor
- {-2} Minute
- {-3} Minuette
- {-4} Subminuette
- {-5} Micro
- {-6} Submicro
- {-7} Minuscule
By Tim Bovee, Portland, Oregon, February 10, 2021
Disclaimer
Tim Bovee, Private Trader tracks the analysis and trades of a private trader for his own accounts. Nothing in this blog constitutes a recommendation to buy or sell stocks, options or any other financial instrument. The only purpose of this blog is to provide education and entertainment.
No trader is ever 100 percent successful in his or her trades. Trading in the stock and option markets is risky and uncertain. Each trader must make trading decisions for his or her own account, and take responsibility for the consequences.
License
All content on Tim Bovee, Private Trader by Timothy K. Bovee is licensed under a Creative Commons Attribution-ShareAlike 4.0 International License.
Based on a work at www.timbovee.com.

You must be logged in to post a comment.