1:55 p.m. New York time
What’s happening now? TSLA accelerated its decline from a peak of 900.40 set on January 25, reach as low as 619 in afternoon trading.
What does it mean? The stock is in the early stages of a downward movement correcting the rise that began in June 2019.
What are the alternatives? The decline hasn’t been that large yet, and even though the rise from has met all of the requirements for completion, it’s possible that the present drop is a lower-level correction within the larger uptrend. The lower the price, the less likely the alternative scenario.
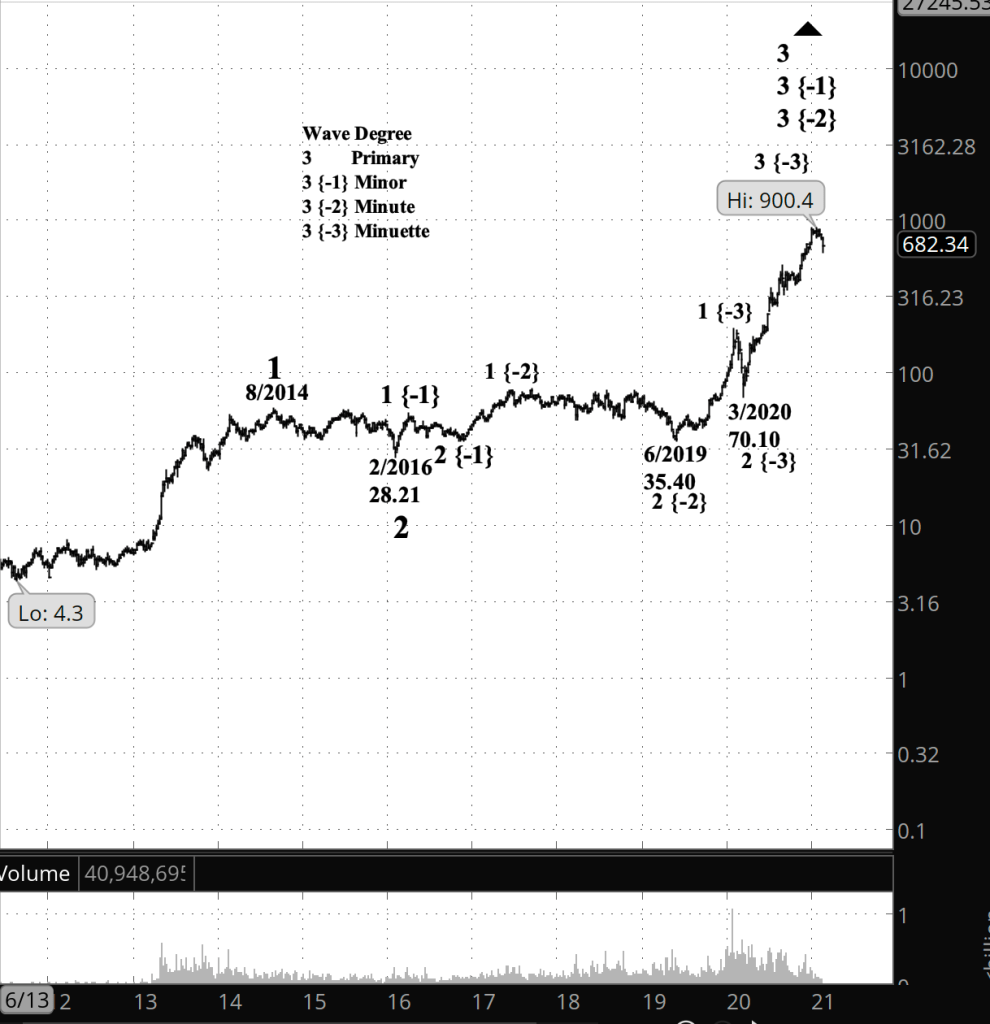
What does Elliott wave theory say? TSLA by my principle count has completed wave 3 of Minuette degree and has embarked on a wave 4 correction to the downside. This is happening within a series of 3rd waves all the way to Primary degree. The whole Primary degree movement is within an uptrending Intermediate degree that began in August 2011 from 4.30.
Returning to the Minuette degree: 4th waves tend to be shallow, so I expect the price to remain well above the beginning of wave 3 from 70.10 in March 2020. After the 4th wave is complete, then the price will push upward to new highs.
Learning and other resources. Elliott Wave International has long been the leading analytical house based on Elliott wave theory. They make available a number of free educational materials and other resources, in addition to their for-pay subscriptions.
I recommend two books, both by people associated with EWI.
First, Elliott Wave Principle by Robert Prechter and A.J. Frost is the book that, along with Prechter’s analyses, that created the revival of Elliott wave theory. I first read it in 1984, and it has had a profound influenced on my thinking about markets ever since.
Second, I’ve found Visual Guide to Elliott Wave Trading by Wayne Gorman and Jeffrey Kennedy, both of EWI, to be a useful book that relates Elliott wave theory to practical trading. The authors are hands-on Elliotticians, and for an active trader, that’s exactly what’s needed — less theory and more how-to. The first chapter of the book gives a very nice thumbnail run down of what Elliott wave theory is all about.
Terminology. Here are some links to information about some of the technical jargon I use.
Charts. On my charts, waves have a subscript showing the degree above or below the Intermediate degree. Here are the subscripts and the degree each represents:
- {+3} Supercycle
- {+2} Cycle
- {+1} Primary
- No subscript: Intermediate
- {-1} Minor
- {-2} Minute
- {-3} Minuette
- {-4} Subminuette
- {-5} Micro
- {-6} Submicro
- {-7} Minuscule
By Tim Bovee, Portland, Oregon, February 23, 2021
Disclaimer
Tim Bovee, Private Trader tracks the analysis and trades of a private trader for his own accounts. Nothing in this blog constitutes a recommendation to buy or sell stocks, options or any other financial instrument. The only purpose of this blog is to provide education and entertainment.
No trader is ever 100 percent successful in his or her trades. Trading in the stock and option markets is risky and uncertain. Each trader must make trading decisions for his or her own account, and take responsibility for the consequences.
License
All content on Tim Bovee, Private Trader by Timothy K. Bovee is licensed under a Creative Commons Attribution-ShareAlike 4.0 International License.
Based on a work at www.timbovee.com.

[…] I’ve posted an analysis of Tesla (TSLA). […]
LikeLike