3:30 p.m. New York time
Half an hour before the closing bell. The S&P 500 rose past sharply during the day, reaching a high of 3924.75 on the futures, 3928.39 on the index. I’ve updated the chart below adjusting some of the internal count to avoid wave 3 of Bitsy degree being the shortest wave, which is forbidden under the rules of Elliott wave analysis.
9:55 a.m. New York time
What’s happening now? The S&P 500 E-mini futures continued its upward correction in overnight trading.
What does it mean? Once the correction has ended, the price will resume the downtrend that began February 15, moving below yesterday’s low, 3804.75.
What are the alternatives? The correction can be analyzed as having been completed with the overnight high of 3874.50. I consider this to be the slightly less likely analysis.
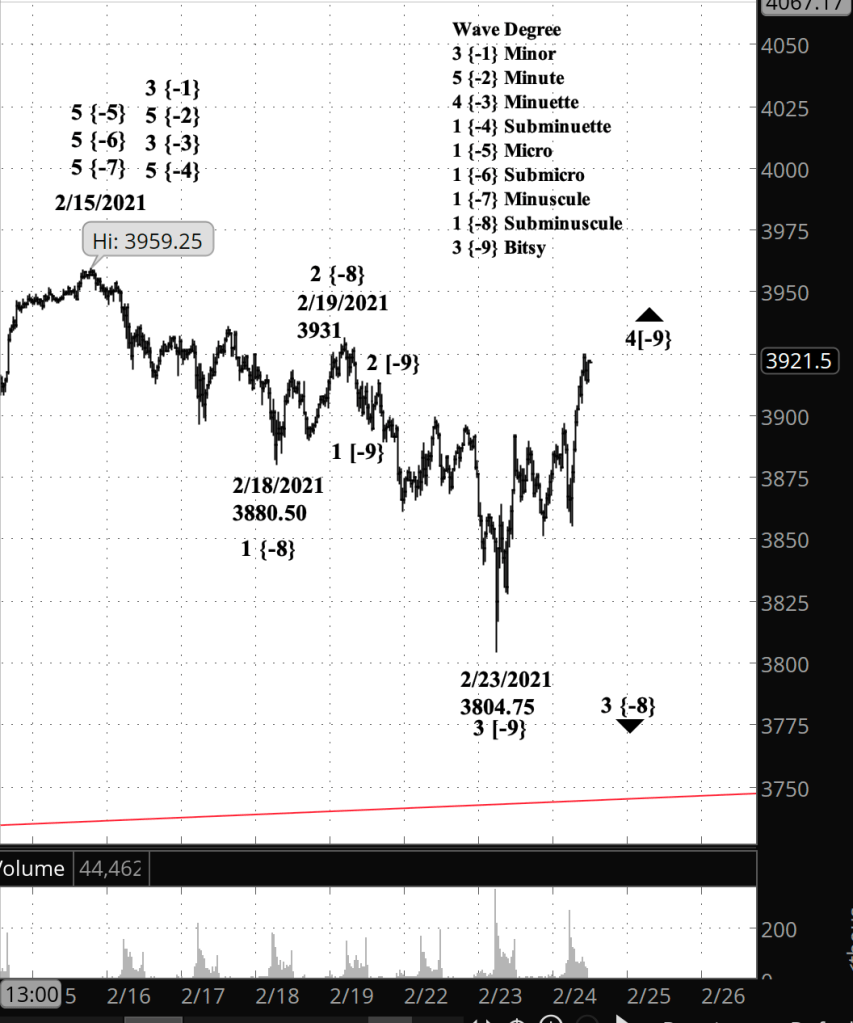
What does Elliott wave theory say? The rise from February 23 is wave 4 of Bitsy degree. Fourth waves tend to be shallow, and this one is not, having come within 3 points of the start of Bitsy wave 3. So I don’t have a lot of confidence in the principle analysis compared to the alternate. In either case, once wave 4 is complete, the 5th wave that follows will move below the end of wave 3.
Learning and other resources. Elliott Wave International has long been the leading analytical house based on Elliott wave theory. They make available a number of free educational materials and other resources, in addition to their for-pay subscriptions.
I recommend two books, both by people associated with EWI.
First, Elliott Wave Principle by Robert Prechter and A.J. Frost is the book that, along with Prechter’s analyses, that created the revival of Elliott wave theory. I first read it in 1984, and it has had a profound influenced on my thinking about markets ever since.
Second, I’ve found Visual Guide to Elliott Wave Trading by Wayne Gorman and Jeffrey Kennedy, both of EWI, to be a useful book that relates Elliott wave theory to practical trading. The authors are hands-on Elliotticians, and for an active trader, that’s exactly what’s needed — less theory and more how-to. The first chapter of the book gives a very nice thumbnail run down of what Elliott wave theory is all about.
Terminology. Here are some links to information about some of the technical jargon I use.
Charts. On my charts, waves have a subscript showing the degree above or below the Intermediate degree. Here are the subscripts and the degree each represents:
- {+3} Supercycle
- {+2} Cycle
- {+1} Primary
- No subscript: Intermediate
- {-1} Minor
- {-2} Minute
- {-3} Minuette
- {-4} Subminuette
- {-5} Micro
- {-6} Submicro
- {-7} Minuscule
By Tim Bovee, Portland, Oregon, February 24, 2021
Disclaimer
Tim Bovee, Private Trader tracks the analysis and trades of a private trader for his own accounts. Nothing in this blog constitutes a recommendation to buy or sell stocks, options or any other financial instrument. The only purpose of this blog is to provide education and entertainment.
No trader is ever 100 percent successful in his or her trades. Trading in the stock and option markets is risky and uncertain. Each trader must make trading decisions for his or her own account, and take responsibility for the consequences.
License
All content on Tim Bovee, Private Trader by Timothy K. Bovee is licensed under a Creative Commons Attribution-ShareAlike 4.0 International License.
Based on a work at www.timbovee.com.

[…] 1 of Subminuette degree, and the rise that followed becomes Subminuette wave 2. (See my chart in yesterday’s post to compare the new count with the old one.) That eliminates the problematic 4th wave and provides a […]
LikeLike