3:05 p.m. New York time
A new analysis. Although the S&P 500 index has broken above its February 15 high, showing that the year-long uptrend is continuing, the S&P 500 futures remain below that high, creating a discrepancies. Both the index and the futures are derivatives of a collection of corporate equities. The index is derived from the price of the stocks, and the futures are derived from the index.
For the following Elliott wave analysis I’ve taken the index as definitive, assuming that the futures will follow, since the index is one step closer to the stocks from which both products are derived.
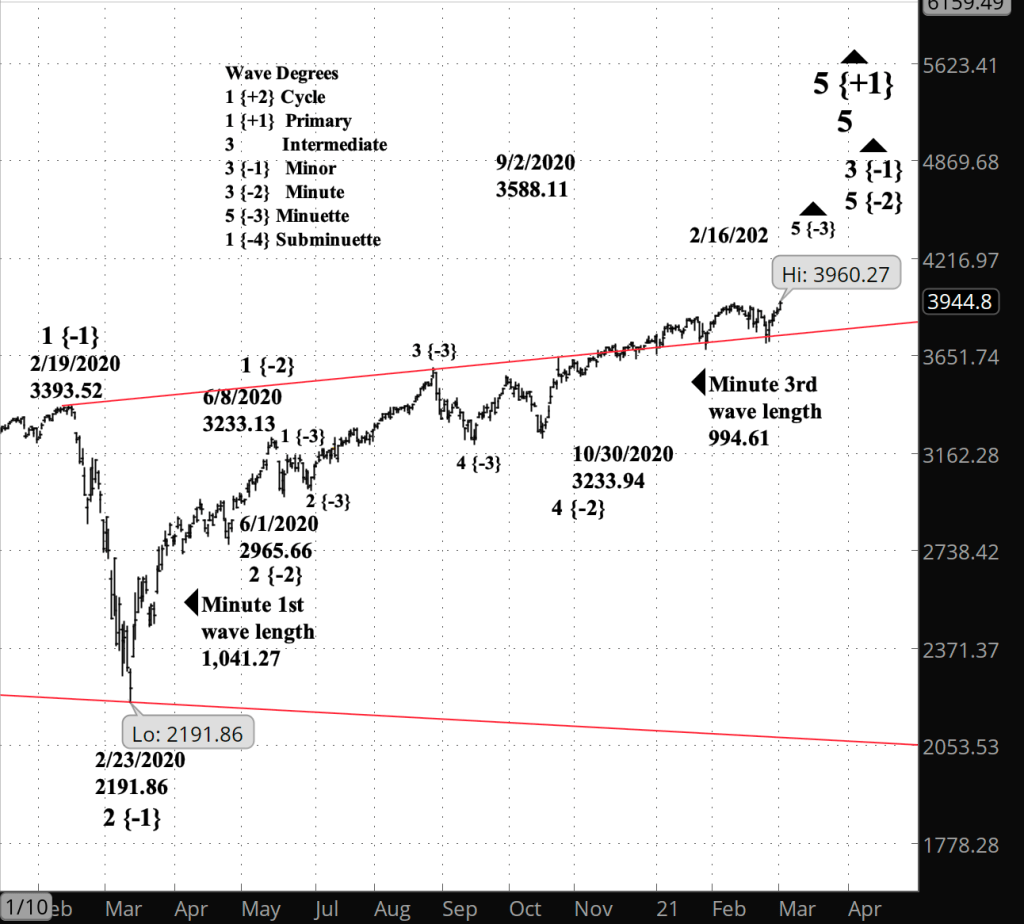
Note that wave 3 of Minute degree, which began on June 1, 2020, is shorter than the preceding 1st wave. That means that either Minute wave 3 will continue to rise until it’s longer than Minute 1, or if wave 3 comes up short, then the future wave 5 of Minute degree can be no longer than Minute 1.
First, the big picture. The rise since March 4 is wave of Minuette degree within wave 5 of Minute degree within wave 3 of Minor degree. The Minor 3rd wave began on February 23, 2020 and so far has reached a peak on the index of 3960.27.
Second, the smaller picture. The wave 2 correction of Micro degree began on March 4 from 3720.50 on the futures and has so far reached a high of 3958.50, still below the end of wave 1 on February 15, at 3959.25. The subsequent rise is wave 3 of Micro degree, and within it, wave 3 of Submicro degree.
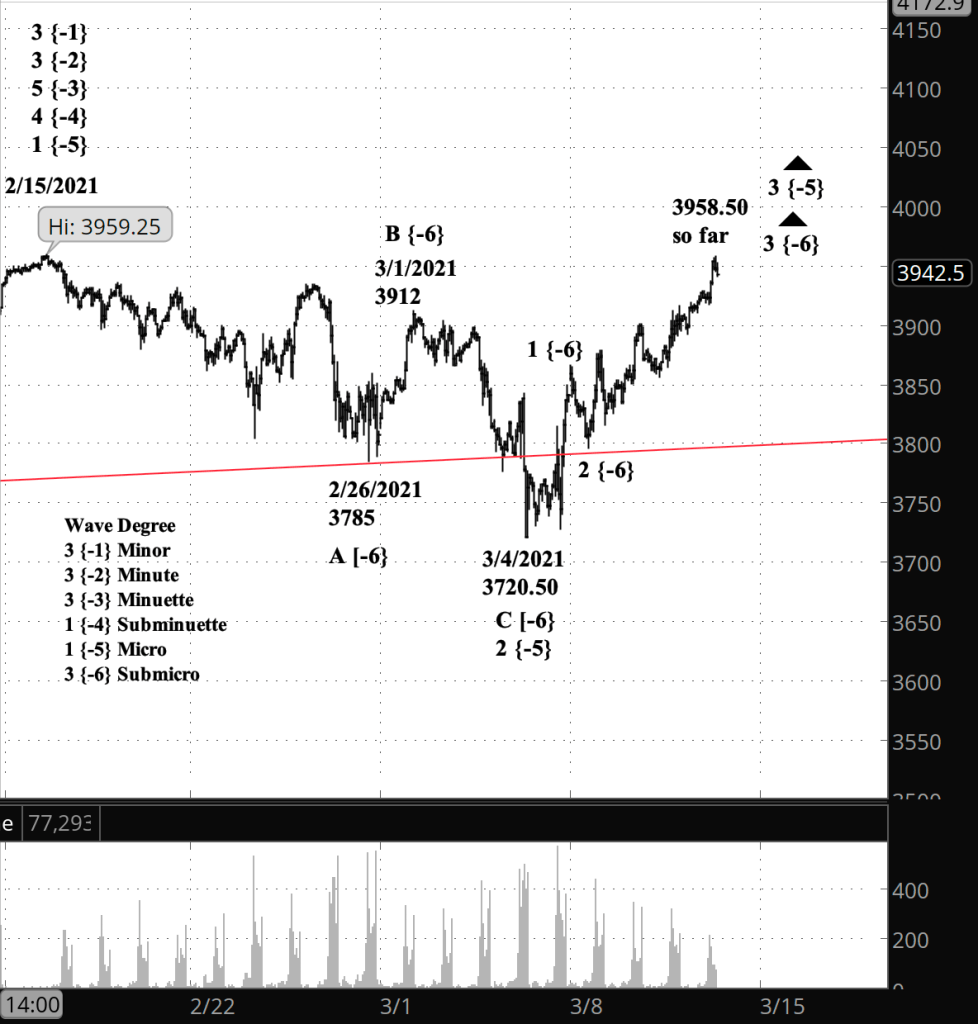
I’ve left this morning’s chart below, with its now invalidated analysis, unchanged so it can be used for comparison.
2 p.m. New York time
Break-out. The S&P 500 index has risen above its high of February 15, invalidating Elliott wave analysis that saw the subsequent decline as the beginning of a downtrend. The rise from February 23, 2020, beginning from 2191.86, is still underway. The February 15 high on the index was 3950.43. The highest point in today’s index is 3960.27. The S&P 500 futures remain below their February 15 high, which was 3959.25. The highest point in today’s futures trading is 3958.50.
9:35 a.m. New York time
What’s happening now? The S&P 500 E-mini futures continued their relentless rise in the low-level upward correction that began on March 4, reaching a high of 3925 in overnight trading.
What does it mean? If the price reverses to the downside before reaching 3959.25, then the downward movement that began on February 15 from that level will resume, falling below 3720.50, perhaps significantly so.
What are the alternatives? If the price exceeds 3959.25, then the upward movement did not end on February 15 but is still underway, and we can expect a series of higher highs.
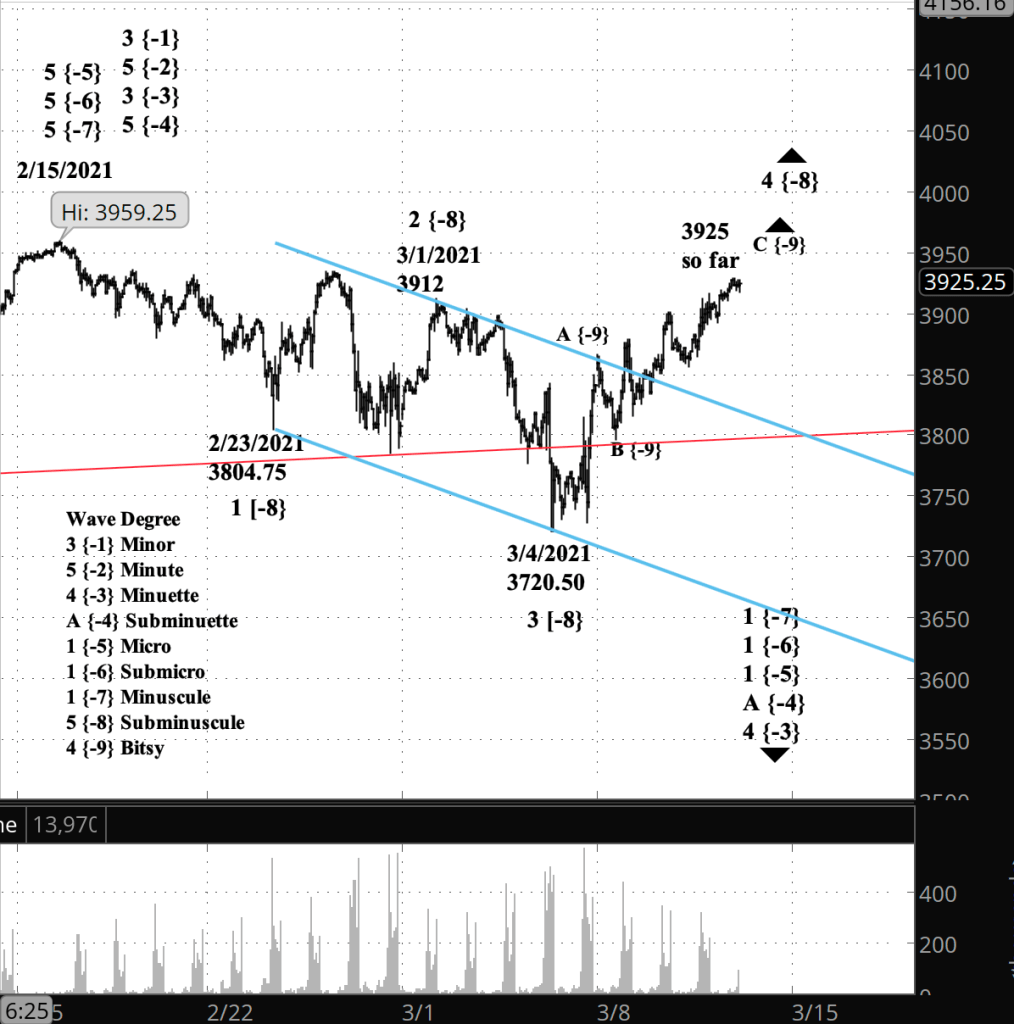
What does Elliott wave theory say? The upward correction under the principle analysis is wave 4 of Subminuscule degree, and within it, wave C of Bitsy degree is in its 4th day. Big picture: The February 15 peak marked the end of the 5th wave all the way up to Subminuette degree and the beginning of a major decline reaching all the way up to Minor degree.
However, if the alternate count proves to be valid, then the February peak marks the end of wave 3 of Subminuette degree, and the subsequent decline is a wave 4 correction at the Subminuette level.
As is always the case with Elliott wave analysis, and indeed, with life, nothing is ever certain.
Learning and other resources. Elliott Wave International has long been the leading analytical house based on Elliott wave theory. They make available a number of free educational materials and other resources, in addition to their for-pay subscriptions.
I recommend two books, both by people associated with EWI.
First, Elliott Wave Principle by Robert Prechter and A.J. Frost is the book that, along with Prechter’s analyses, that created the revival of Elliott wave theory. I first read it in 1984, and it has had a profound influenced on my thinking about markets ever since.
Second, I’ve found Visual Guide to Elliott Wave Trading by Wayne Gorman and Jeffrey Kennedy, both of EWI, to be a useful book that relates Elliott wave theory to practical trading. The authors are hands-on Elliotticians, and for an active trader, that’s exactly what’s needed — less theory and more how-to. The first chapter of the book gives a very nice thumbnail run down of what Elliott wave theory is all about.
Terminology. Here are some links to information about some of the technical jargon I use.
Charts. On my charts, waves have a subscript showing the degree above or below the Intermediate degree. Here are the subscripts and the degree each represents:
- {+3} Supercycle
- {+2} Cycle
- {+1} Primary
- No subscript: Intermediate
- {-1} Minor
- {-2} Minute
- {-3} Minuette
- {-4} Subminuette
- {-5} Micro
- {-6} Submicro
- {-7} Minuscule
- {-8} Subminuscule
- {-9} Bitsy
- {-10} Subbitsy
By Tim Bovee, Portland, Oregon, March 11, 2021
Disclaimer
Tim Bovee, Private Trader tracks the analysis and trades of a private trader for his own accounts. Nothing in this blog constitutes a recommendation to buy or sell stocks, options or any other financial instrument. The only purpose of this blog is to provide education and entertainment.
No trader is ever 100 percent successful in his or her trades. Trading in the stock and option markets is risky and uncertain. Each trader must make trading decisions for his or her own account, and take responsibility for the consequences.
License
All content on Tim Bovee, Private Trader by Timothy K. Bovee is licensed under a Creative Commons Attribution-ShareAlike 4.0 International License.
Based on a work at www.timbovee.com.

You must be logged in to post a comment.