3:30 p.m. New York time
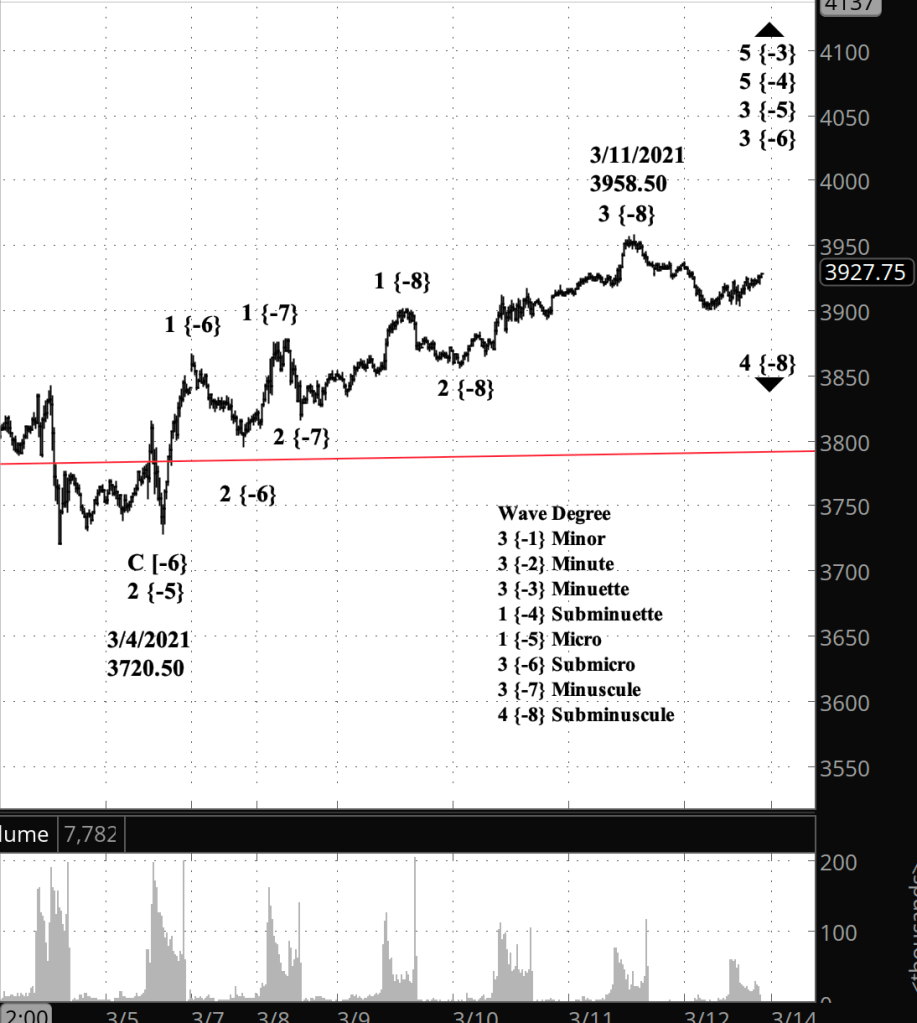
Half an hour before the closing bell. The S&P 500 E-mini futures completed the first very small scale downward movement (an A wave) in a correction that began March 11, and then rose very slightly (a B wave) in a shallow upward movement. The structure is within the 4th wave of Subminuscule degree, which appears to be shaping up as a shallow Flat pattern. I’ve updated the short-term chart, the first of the two charts below.
10:10 a.m. New York time
What’s happening now? The S&P 500 E-mini futures continued to move sideways in overnight trading as it went through a small correction within the rise since March 4.
What does it mean? The correction will be followed in short order by a further rise will almost certainly penetrate yesterday’s high of 3958.50. The completion of that further rise will trigger a correction of a larger degree, which will be followed by another upward move.
What are the alternatives? The rise could fall short of that prior high and still be within the rules of Elliott wave analysis, in condition called a “truncation”.
What does Elliott wave theory say? Yesterday’s breakout signaled that the Minor wave uptrend that began February 23, 2020 is still underway.
The short-term upper chart shows a typical motive wave in the direction of the main trend, with the usual waves within waves pattern that characterize the markets. The small, sideways correction is wave 4 of Subminuscule degree within a series of uptrending wave, from Minuscule up to Supercycle, which covers quite a bit territory. The Minuscule wave began on March 8, four days ago. The Supercycle wave began on October 5, 1929.
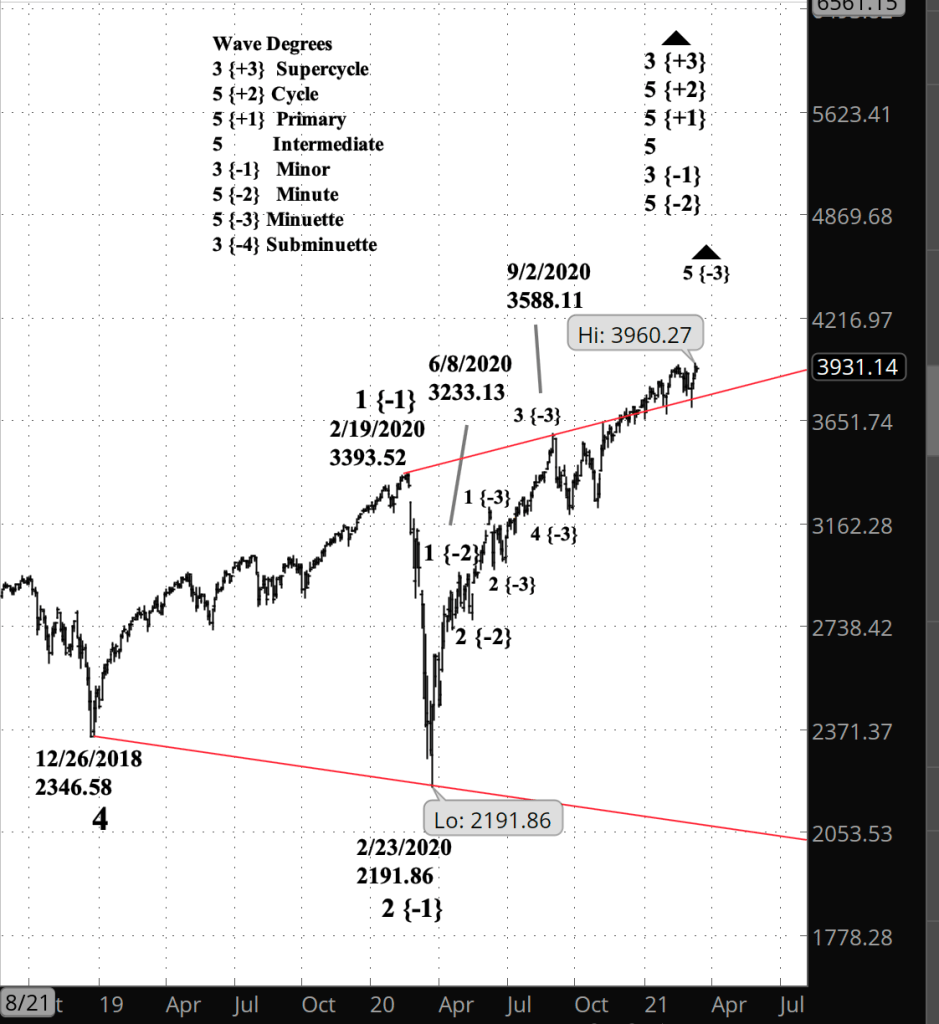
To summarize the big picture on the lower chart, the rise that began on February 23, 2020 from 2346.58 is Minor wave 3. Within it, working from smaller to larger, the S&P 500 index is moving through Minuette wave 5 of Minute wave 5. Minor wave 3 is part of Intermediate wave 5 within Primary wave 1 within Cycle wave 1.
So what does all of that mean for the Expanding Diagonal Triangle that began on December 26, 2018, the red lines on the long-term chart that a reader of Private Trader has aptly described as a megaphone? And the answer is, no impact. The price broke above the upper boundary of the triangle last December and has continued to bounce along the line ever since. The bouncing will end with the completion of wave 3 of Minor degree. The next movement will be wave 4, which by the rules of Elliott wave analysis will eventually reach the lower boundary, presently around 2080 but sinking further each day. If wave 4 instead proves to be a shallow correction, then the analysis that resulted in the Diagonal Triangle will need to be revised.
After Minor wave 4 is complete, if the triangle remains intact, then the next move will Minor wave 5, which will return to the upper boundary, presently in the 3390s but rising each day. Completion of the 5th wave of Minor degree will mark the end of the Diagonal Triangle and the end of the parent wave, Primary wave 5, and moving the ladder of degrees, also the completion of Cycle wave 5 within Supercycle wave 3.
For perspective: Cycle wave 5 began on December 9, 1974 from a price of 570. (Three figures — 570 — is correct, not a typo.) So given that high degree, the decline that follows the end of Cycle wave 5 will be with us, almost certainly, for decades, and given the fractal nature of the Elliott waves that we use to describe the market, will provide plenty of opportunity for both bull and bear trades.
Learning and other resources. Elliott Wave International has long been the leading analytical house based on Elliott wave theory. They make available a number of free educational materials and other resources, in addition to their for-pay subscriptions.
I recommend two books, both by people associated with EWI.
First, Elliott Wave Principle by Robert Prechter and A.J. Frost is the book that, along with Prechter’s analyses, that created the revival of Elliott wave theory. I first read it in 1984, and it has had a profound influenced on my thinking about markets ever since.
Second, I’ve found Visual Guide to Elliott Wave Trading by Wayne Gorman and Jeffrey Kennedy, both of EWI, to be a useful book that relates Elliott wave theory to practical trading. The authors are hands-on Elliotticians, and for an active trader, that’s exactly what’s needed — less theory and more how-to. The first chapter of the book gives a very nice thumbnail run down of what Elliott wave theory is all about.
Terminology. Here are some links to information about some of the technical jargon I use.
Charts. On my charts, waves have a subscript showing the degree above or below the Intermediate degree. Here are the subscripts and the degree each represents:
- {+3} Supercycle
- {+2} Cycle
- {+1} Primary
- No subscript: Intermediate
- {-1} Minor
- {-2} Minute
- {-3} Minuette
- {-4} Subminuette
- {-5} Micro
- {-6} Submicro
- {-7} Minuscule
- {-8} Subminuscule
- {-9} Bitsy
- {-10} Subbitsy
By Tim Bovee, Portland, Oregon, March 12, 2021
Disclaimer
Tim Bovee, Private Trader tracks the analysis and trades of a private trader for his own accounts. Nothing in this blog constitutes a recommendation to buy or sell stocks, options or any other financial instrument. The only purpose of this blog is to provide education and entertainment.
No trader is ever 100 percent successful in his or her trades. Trading in the stock and option markets is risky and uncertain. Each trader must make trading decisions for his or her own account, and take responsibility for the consequences.
License
All content on Tim Bovee, Private Trader by Timothy K. Bovee is licensed under a Creative Commons Attribution-ShareAlike 4.0 International License.
Based on a work at www.timbovee.com.

You must be logged in to post a comment.