3:30 p.m. New York time
Half an hour before the closing bell. The S&P 500 moved above Friday’s high of 3968 on the index, to 3970.25., and a high of 3978.19 on the index, to 3968. I dislike this chart immensely. Wave 2 of Subminuscule degree seems overly shallow for a 2nd wave, and wave 4 seems overly robust. And there’s the whole breaking past the end of wave 3, which isn’t strictly forbidden, but it certainly casts doubt on the count.
I think the most likely alternative is that wave 4 of Subminuette degree is still underway, and the rise from February 23, 2020 is not yet complete. I’ve left the chart numbering as it was, and will present a renumbered version in Tuesday’s post. I’ve updated the priceline in the chart below, but not the wave numbers.
9:35 a.m. New York time
What’s happening now? The S&P 500 E-mini futures declined from Friday’s peak, 3968, in overnight trading, reaching 3928.75 today hours before the opening bell.
What does it mean? The decline adds weight to the idea idea that Friday’s peak marked the end of the upward correction that began on March 25 and the beginning of a downtrend that will end in the 3850s or below.
What are the alternatives? First alternative: The decline from Friday could be followed by a second corrective pattern, and if that proves to be the case, then the correction is still underway. More on this in the Elliott wave section, below.
Second alternative: And if the price moves above Friday’s peak, then the chart will demand a recount showing that the rise that began on February 23, 2020 is sitill in progress.
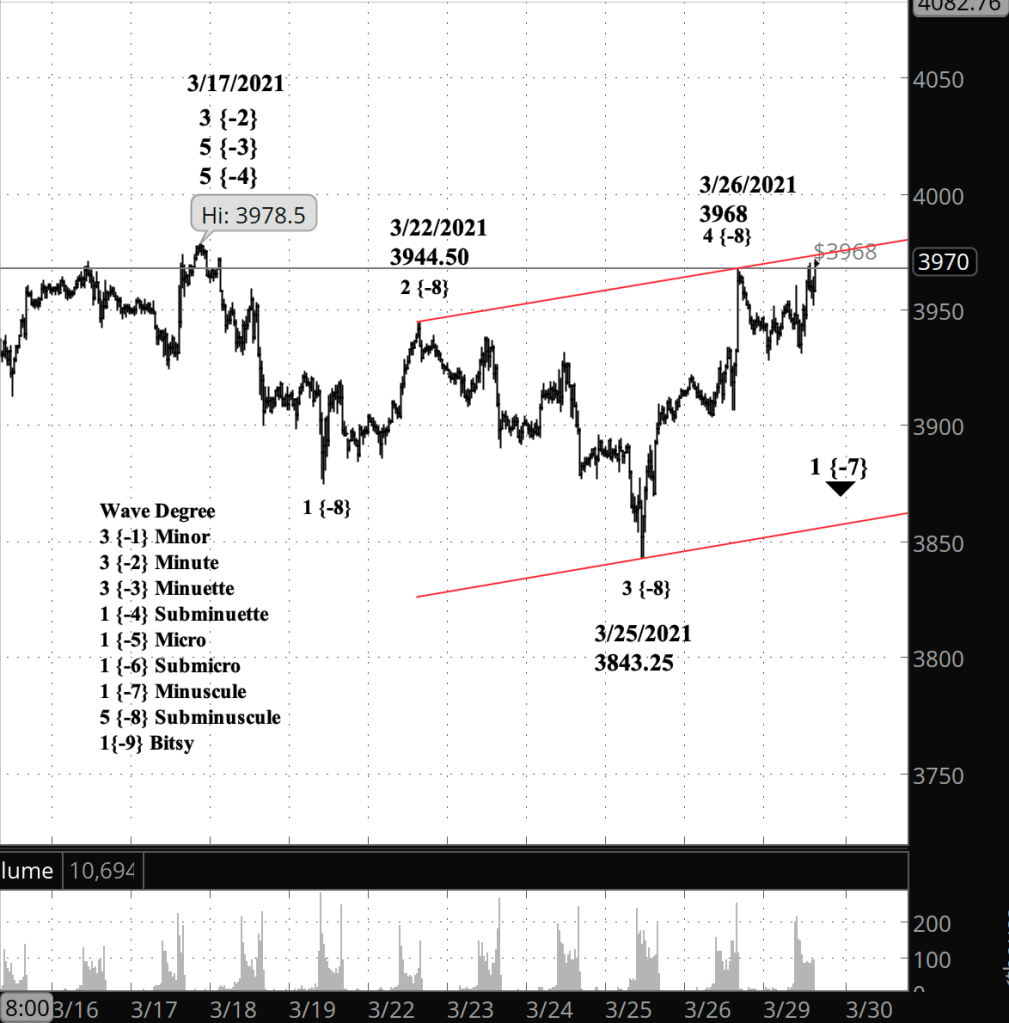
What does Elliott wave theory say? By my principle count, Friday’s high was the end of wave 4 of Subminuscule degree and the beginning of wave 5. My first alternate count has wave 4 still in progress, with the decline since Friday being an X wave, which separates two corrective patterns within a compound correction structure.
How to tell the difference? If wave 5 is underway, then the first downward wave, the 1st of Bitsy degree, will have five waves internally. It will be a standard impulse wave. If wave 4 is extending into a compound structure, then the X wave will have three subwaves in its downward move: A down, B up and C down. At this low level I think we’ll know which is happening within a day or two.
On the assumption that my principle analysis is correct, that wave 5 of Subminuscule degree began on March 26, I’ve added in a price channel (red lines) for the Minuscule wave 1 downtrend that began on March 17, connecting the beginnings of Subminuscule waves 3 and 5 for the upper boundary and the end of Subminuscule wave 3 for the lower boundary.
It’s an uptrending channel for the internals of a downtrending wave. If Subminuscule wave 5 stays within the channel boundaries, then it will be truncated, failing to move below the end of the preceding wave 3. It would not be surprising if wave 5 broke through the boundary in a throw-over move, the kind of move that in 5th wave can sometimes turnout to be quite dramatic in the extent to which it moves beyond the boundary. For 5th waves, the channel boundary is often nothing more than a gentle suggestion.
Learning and other resources. Elliott Wave International has long been the leading analytical house based on Elliott wave theory. They make available a number of free educational materials and other resources, in addition to their for-pay subscriptions.
I recommend two books, both by people associated with EWI.
First, Elliott Wave Principle by Robert Prechter and A.J. Frost is the book that, along with Prechter’s analyses, that created the revival of Elliott wave theory. I first read it in 1984, and it has had a profound influenced on my thinking about markets ever since.
Second, I’ve found Visual Guide to Elliott Wave Trading by Wayne Gorman and Jeffrey Kennedy, both of EWI, to be a useful book that relates Elliott wave theory to practical trading. The authors are hands-on Elliotticians, and for an active trader, that’s exactly what’s needed — less theory and more how-to. The first chapter of the book gives a very nice thumbnail run down of what Elliott wave theory is all about.
Terminology. Here are some links to information about some of the technical jargon I use.
Charts. On my charts, waves have a subscript showing the degree above or below the Intermediate degree. Here are the subscripts and the degree each represents:
- {+3} Supercycle
- {+2} Cycle
- {+1} Primary
- No subscript: Intermediate
- {-1} Minor
- {-2} Minute
- {-3} Minuette
- {-4} Subminuette
- {-5} Micro
- {-6} Submicro
- {-7} Minuscule
- {-8} Subminuscule
- {-9} Bitsy
- {-10} Subbitsy
By Tim Bovee, Portland, Oregon, March 29, 2021
Disclaimer
Tim Bovee, Private Trader tracks the analysis and trades of a private trader for his own accounts. Nothing in this blog constitutes a recommendation to buy or sell stocks, options or any other financial instrument. The only purpose of this blog is to provide education and entertainment.
No trader is ever 100 percent successful in his or her trades. Trading in the stock and option markets is risky and uncertain. Each trader must make trading decisions for his or her own account, and take responsibility for the consequences.
License
All content on Tim Bovee, Private Trader by Timothy K. Bovee is licensed under a Creative Commons Attribution-ShareAlike 4.0 International License.
Based on a work at www.timbovee.com.

You must be logged in to post a comment.