3:30 p.m. New York time
Half an hour before the closing bell. The S&P 500 dawdled throughout the day, remaining so far within a range of less than 30 points. No change to the analysis. I’ve updated the chart below.
10 a.m. New York time
What’s happening now? The S&P 500 E-mini futures dropped off from yesterday’s peak.
What does it mean? Yesterday’s ambiguities in the chart remain. I’m retaining my principle analysis, which puts the end of the correction at yesterday’s peak.
What are the alternatives? Alternatively, yesterday’s peak marks the end of a leg within correction and the correction is continuing.
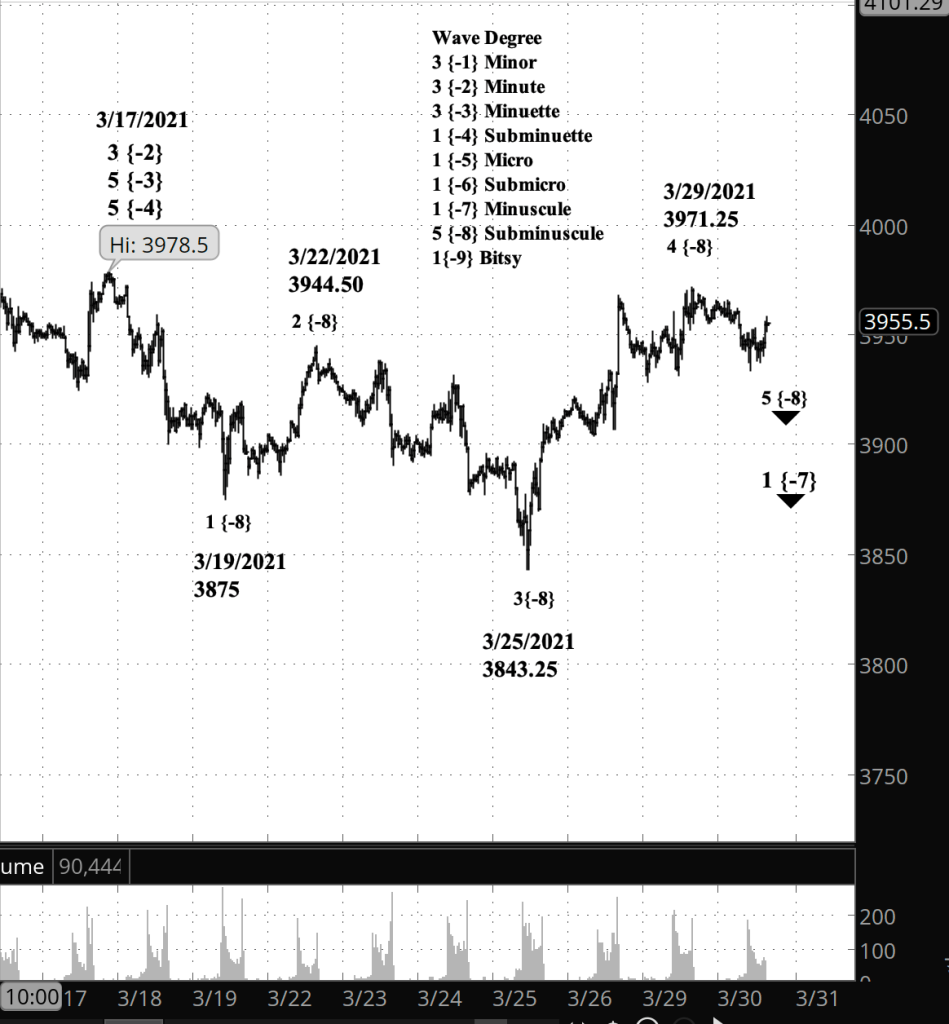
What does Elliott wave theory say? Unchanged from yesterday. The alternatives I tried out either violated rules of Elliott wave analysis or were misshapen in ways that detracted from their credibility. Ending wave 4 of Subminuscule degree at the March 29 high of 3971.25 seems to be the most straightforward reading of the chart. Under this analysis yesteday marked the beginning of wave 5 of Subminuscule degree.
If the price resumes its rise and moves above the March 17 high of 3978.50, the end of the rise of Minuette degree, then the entire analysis of the rise from February of last year will need to be revisited.
If the price falls below 3843.25, the low of March 25, then then Subminuscule wave 5 is confirmed.
Learning and other resources. Elliott Wave International has long been the leading analytical house based on Elliott wave theory. They make available a number of free educational materials and other resources, in addition to their for-pay subscriptions.
I recommend two books, both by people associated with EWI.
First, Elliott Wave Principle by Robert Prechter and A.J. Frost is the book that, along with Prechter’s analyses, that created the revival of Elliott wave theory. I first read it in 1984, and it has had a profound influenced on my thinking about markets ever since.
Second, I’ve found Visual Guide to Elliott Wave Trading by Wayne Gorman and Jeffrey Kennedy, both of EWI, to be a useful book that relates Elliott wave theory to practical trading. The authors are hands-on Elliotticians, and for an active trader, that’s exactly what’s needed — less theory and more how-to. The first chapter of the book gives a very nice thumbnail run down of what Elliott wave theory is all about.
Terminology. Here are some links to information about some of the technical jargon I use.
Charts. On my charts, waves have a subscript showing the degree above or below the Intermediate degree. Here are the subscripts and the degree each represents:
- {+3} Supercycle
- {+2} Cycle
- {+1} Primary
- No subscript: Intermediate
- {-1} Minor
- {-2} Minute
- {-3} Minuette
- {-4} Subminuette
- {-5} Micro
- {-6} Submicro
- {-7} Minuscule
- {-8} Subminuscule
- {-9} Bitsy
- {-10} Subbitsy
By Tim Bovee, Portland, Oregon, March 30, 2021
Disclaimer
Tim Bovee, Private Trader tracks the analysis and trades of a private trader for his own accounts. Nothing in this blog constitutes a recommendation to buy or sell stocks, options or any other financial instrument. The only purpose of this blog is to provide education and entertainment.
No trader is ever 100 percent successful in his or her trades. Trading in the stock and option markets is risky and uncertain. Each trader must make trading decisions for his or her own account, and take responsibility for the consequences.
License
All content on Tim Bovee, Private Trader by Timothy K. Bovee is licensed under a Creative Commons Attribution-ShareAlike 4.0 International License.
Based on a work at www.timbovee.com.

You must be logged in to post a comment.