3:30 p.m. New York time
Half an hour before the closing bell. The S&P 500 barely budged throughout the day, remaining below the overnight high of 4178.75. No change to the analysis. Chart updated.
9:40 a.m. New York time
What’s happening now? The S&P 500 E-mini futures drifted higher, to 4178.75, when trading resumed Sunday evening and continued to trade slightly below that level
What does it mean? The overnight high might mark the end of a correction that began on May 13. The correction will be followed by an energetic movement to the downside, reaching below 4029.25, the correction’s starting point.
What’s the alternative? The Sunday evening high and small decline might well be a pause in the correction, which will continue higher.
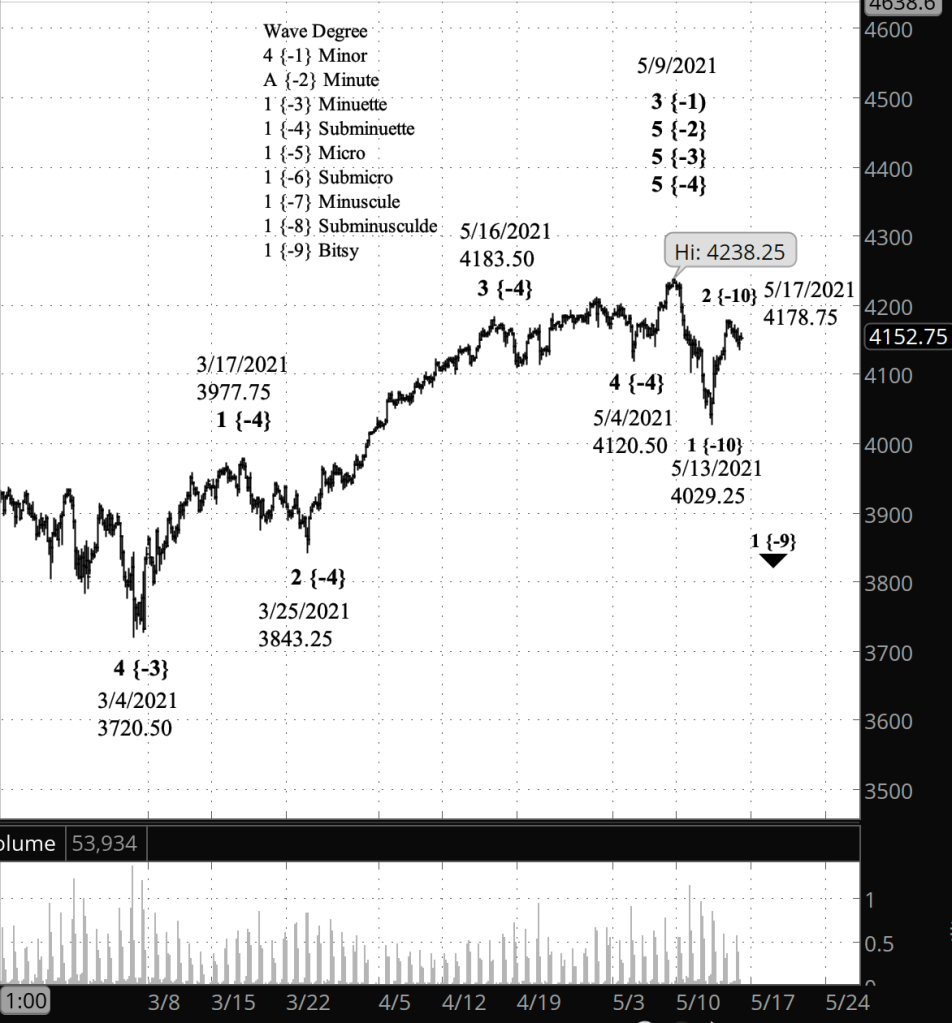
What does Elliott wave theory say? The correction is wave 2 of Subbitsy degree, an early small-degree portion of a larger correction to the downside that began on May 9 from 4238.25. Subbitsy 2 will be followed by a declining Subbitsy wave 3. Third waves tend to be quite energetic, so I’m looking for a bit of drama when that wave 3 kicks in.
Learning and other resources. Elliott Wave International has long been the leading analytical house based on Elliott wave theory. They make available a number of free educational materials and other resources, in addition to their for-pay subscriptions.
I recommend two books, both by people associated with EWI.
First, Elliott Wave Principle by Robert Prechter and A.J. Frost is the book that, along with Prechter’s analyses, that created the revival of Elliott wave theory. I first read it in 1984, and it has had a profound influenced on my thinking about markets ever since.
Second, I’ve found Visual Guide to Elliott Wave Trading by Wayne Gorman and Jeffrey Kennedy, both of EWI, to be a useful book that relates Elliott wave theory to practical trading. The authors are hands-on Elliotticians, and for an active trader, that’s exactly what’s needed — less theory and more how-to. The first chapter of the book gives a very nice thumbnail run down of what Elliott wave theory is all about.
Terminology. Here are some links to information about some of the technical jargon I use.
Charts. On my charts, waves have a subscript showing the degree above or below the Intermediate degree. Here are the subscripts and the degree each represents:
- {+3} Supercycle
- {+2} Cycle
- {+1} Primary
- No subscript: Intermediate
- {-1} Minor
- {-2} Minute
- {-3} Minuette
- {-4} Subminuette
- {-5} Micro
- {-6} Submicro
- {-7} Minuscule
- {-8} Subminuscule
- {-9} Bitsy
- {-10} Subbitsy
By Tim Bovee, Portland, Oregon, May 17, 2021
Disclaimer
Tim Bovee, Private Trader tracks the analysis and trades of a private trader for his own accounts. Nothing in this blog constitutes a recommendation to buy or sell stocks, options or any other financial instrument. The only purpose of this blog is to provide education and entertainment.
No trader is ever 100 percent successful in his or her trades. Trading in the stock and option markets is risky and uncertain. Each trader must make trading decisions for his or her own account, and take responsibility for the consequences.
License
All content on Tim Bovee, Private Trader by Timothy K. Bovee is licensed under a Creative Commons Attribution-ShareAlike 4.0 International License.
Based on a work at www.timbovee.com.

You must be logged in to post a comment.