3:30 p.m. New York time
Half an hour before the closing bell. The S&P 500 continued to meander quietly within a narrow range, staying below the overnight high. No change to the analysis. Chart updated.
9:35 a.m. New York time
What’s happening now? The S&P 500 E-mini futures reached a new high in overnight trading — 4179.50 — less than a point above Monday’s high.
What does it mean? The upward correction that began on May 13 continues and may with the overnight high have reached its peak.
What’s the alternative? … or perhaps 4179.50 isn’t the peak. The upward correction is within a larger downtrend and is within the rules of Elliiott wave analysis as long as the price remains below the start of the downward, 4238.25 on May 9. It’s also possible that the downtrend that began on May 9 is a correction within an ongoing uptrend, which would become the principle analysis should the price move above 4238.25.
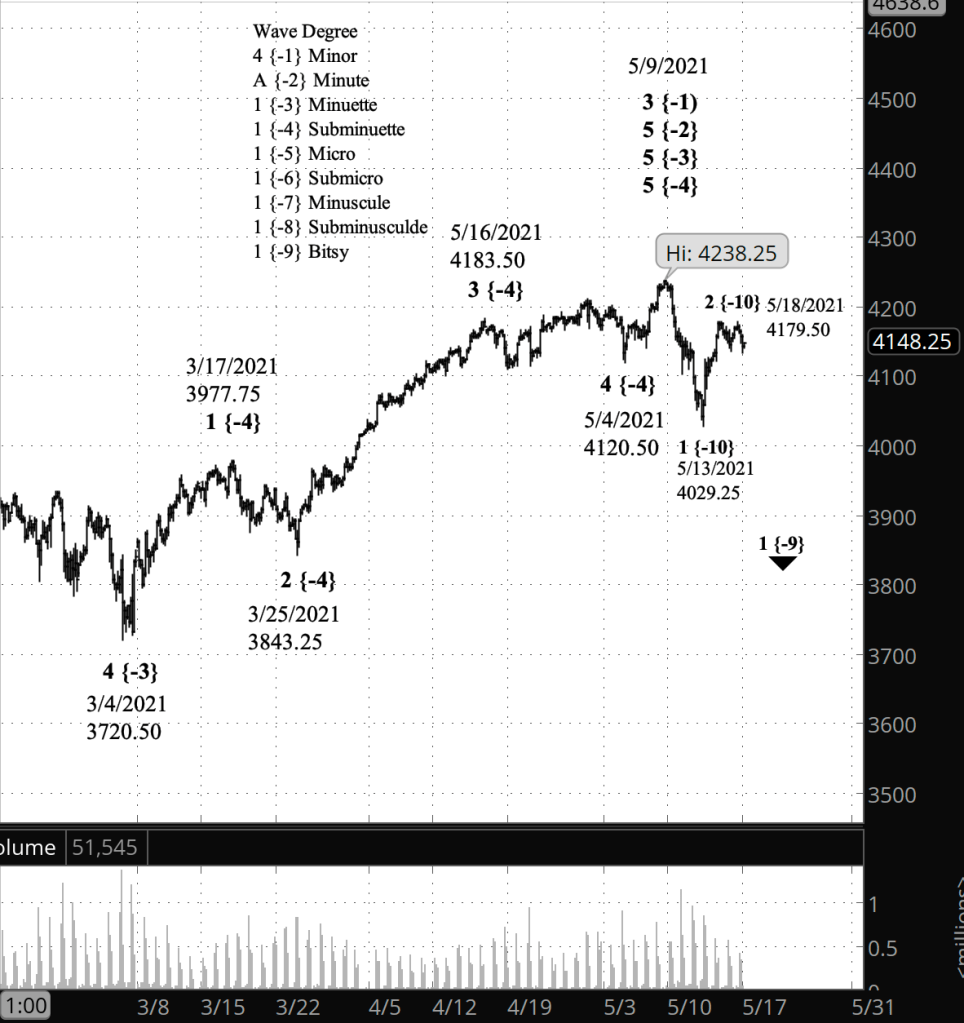
What does Elliott wave theory say? The upward correction is wave 2 of Subbitsy degree within wave 1 of Bitsy degree, the very early subwaves of the downtrend that began May 9. Subbitsy wave 2 will be followed by a 3rd wave that will carry the price below 4029.25, which is where Subbitsy 2 began.
Elliott wave rules forbid a 2nd wave moving beyond the beginning of the previous 1st wave of the same degree, in this case a move above 4238.25. If that were to happen, then the downtrend would be seen as a downward correction within an ongoing uptrend, wave 5 of Minuette degree, which began on October 30, 2020 from 3225.
Learning and other resources. Elliott Wave International has long been the leading analytical house based on Elliott wave theory. They make available a number of free educational materials and other resources, in addition to their for-pay subscriptions.
I recommend two books, both by people associated with EWI.
First, Elliott Wave Principle by Robert Prechter and A.J. Frost is the book that, along with Prechter’s analyses, that created the revival of Elliott wave theory. I first read it in 1984, and it has had a profound influenced on my thinking about markets ever since.
Second, I’ve found Visual Guide to Elliott Wave Trading by Wayne Gorman and Jeffrey Kennedy, both of EWI, to be a useful book that relates Elliott wave theory to practical trading. The authors are hands-on Elliotticians, and for an active trader, that’s exactly what’s needed — less theory and more how-to. The first chapter of the book gives a very nice thumbnail run down of what Elliott wave theory is all about.
Terminology. Here are some links to information about some of the technical jargon I use.
Charts. On my charts, waves have a subscript showing the degree above or below the Intermediate degree. Here are the subscripts and the degree each represents:
- {+3} Supercycle
- {+2} Cycle
- {+1} Primary
- No subscript: Intermediate
- {-1} Minor
- {-2} Minute
- {-3} Minuette
- {-4} Subminuette
- {-5} Micro
- {-6} Submicro
- {-7} Minuscule
- {-8} Subminuscule
- {-9} Bitsy
- {-10} Subbitsy
By Tim Bovee, Portland, Oregon, May 18, 2021
Disclaimer
Tim Bovee, Private Trader tracks the analysis and trades of a private trader for his own accounts. Nothing in this blog constitutes a recommendation to buy or sell stocks, options or any other financial instrument. The only purpose of this blog is to provide education and entertainment.
No trader is ever 100 percent successful in his or her trades. Trading in the stock and option markets is risky and uncertain. Each trader must make trading decisions for his or her own account, and take responsibility for the consequences.
License
All content on Tim Bovee, Private Trader by Timothy K. Bovee is licensed under a Creative Commons Attribution-ShareAlike 4.0 International License.
Based on a work at www.timbovee.com.

You must be logged in to post a comment.