3:30 p.m. New York time
Half an hour before the closing bell. The S&P 500 reached a new high in the uptrending correction that began May 13, up to 4185 on the futures, 4188.72 on the index. The pattern has met the minimum requirements for a C wave within wave 2 of Subbitsy degree, although that’s no guarantee that today’s peak is indeed the end of wave C. A decline below 4029.25, the start of Subbitsy 2, will confirm that wave 3 of Subbitsy degree, to the downside, is now underway. I’ve updated the short-term chart below.
10:05 a.m. New York time
What’s happening now? The S&P 500 E-mini futures traded in a narrow range overnight.
What does it mean? The final leg of an upward correction that began on May 13 continues its rise. It will be followed by an energetic decline as the downtrend that began May 9 continues.
What’s the alternative? A move above the May 9 peak — 4238.25 on the futures, 4238.04 on the index — would mean that the decline from that level was correction within a continuing uptrend that has been underway for months.
What’s the bigger picture? The price remains below the upper boundary, defined by the May 9 peak, of a large-scale expanding diagonal triangle that began on December 26, 2018. The decline from May 9 is the 4th leg within the triangle and can be expected to eventually reach the lower boundary, presently just above 2000 on the index. The 3rd leg’s journey, boundary to boundary, took more than 14 months to complete, and I would a expect a similar timeframe for the 4th leg.
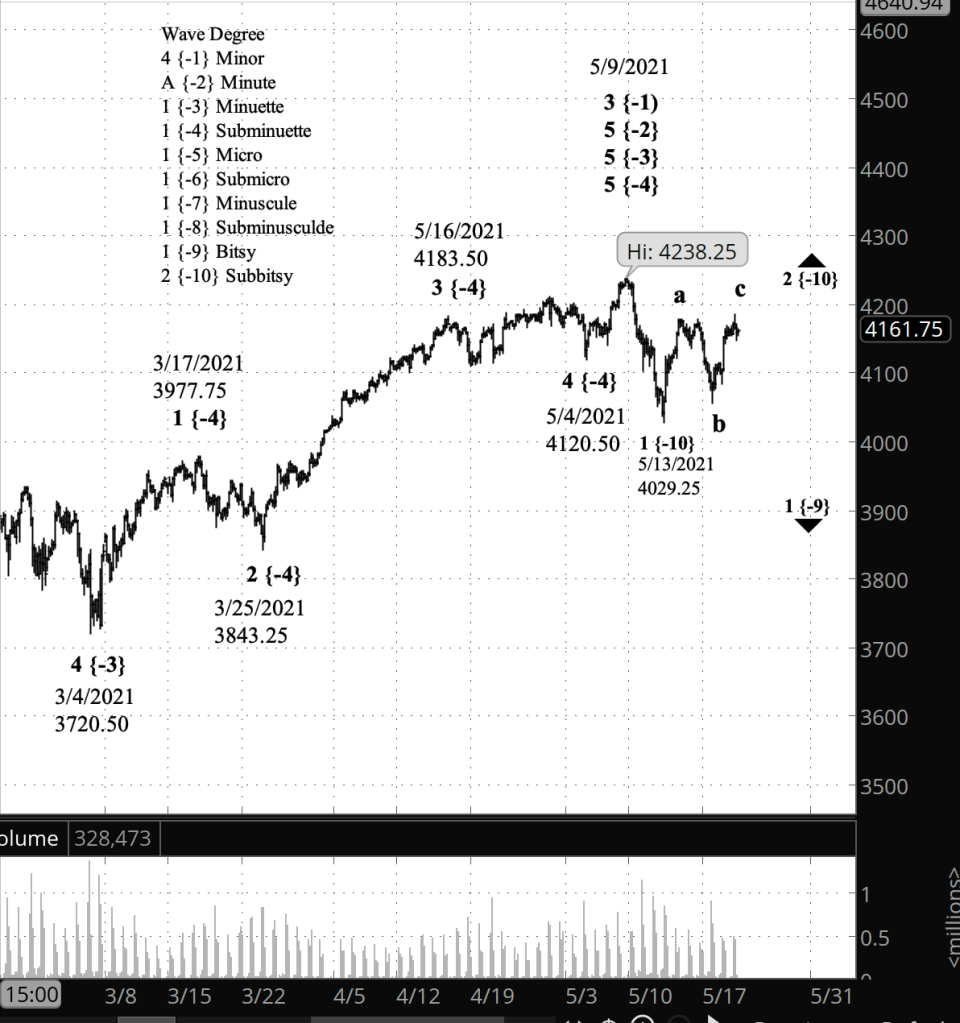
What does Elliott wave theory say? Close up: The decline from May 9 is a 1st wave of Bitsy degree within a series of 1st waves of progressively higher degree, all the way to Minuette degree. Within the Bitsy degree, wave 1 of Subbitsy degree ended on May 13 and the wave 2 correction of Subbitsy degree is now underway, in its rising C wave internally. I expect the end of wave C to complete wave 2, since 2nd waves are less likely to extend in compound patterns.
A move above the start of wave 10 of Subbitsy degree would mean that May 9 wasn’t the peak of the uptrend and would require a full reanalysis under the rules of Elliott wave theory, treating the decline from May 9 as a downward correction within a continuing uptrend.
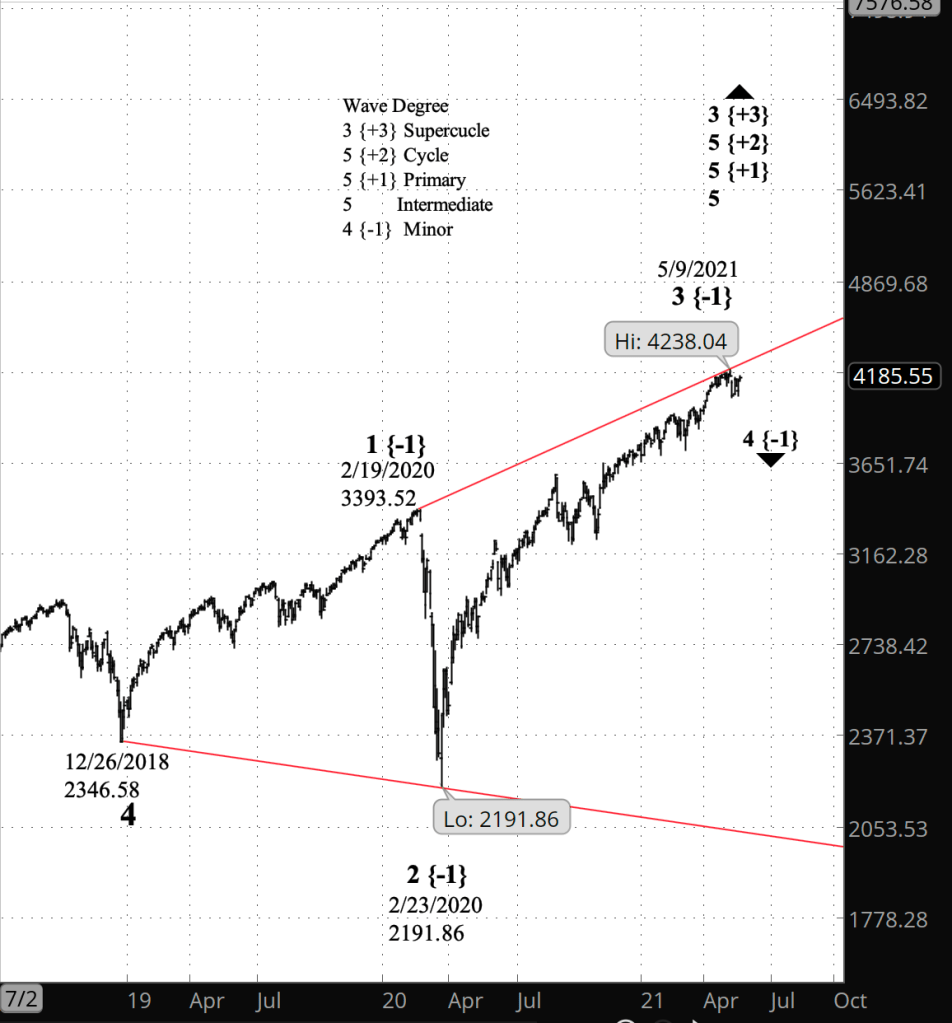
Big picture: The peak of May 9 completed wave 3 of Minor degree and began Minor wave 4, which will eventually — perhaps in 2022 — reach the lower boundary of the expanding diagonal triangle that began in late 2018. Minor 4 will be followed by Minor wave 5, which will work its way back up to the upper boundary of the triangle, which by then will have expanded to well beyond the May 9 high. Minor wave 5 will complete the triangle, along with a series of 5th waves of progressively higher degrees, up to Cycle degree, and marking the end of wave 3 of Supercycle degree, which began in 1932, when markets began to recover from the Crash of 1929. Supercycle 3 will be followed by a 4th wave correction to the downside.
Learning and other resources. Elliott Wave International has long been the leading analytical house based on Elliott wave theory. They make available a number of free educational materials and other resources, in addition to their for-pay subscriptions.
I recommend two books, both by people associated with EWI.
First, Elliott Wave Principle by Robert Prechter and A.J. Frost is the book that, along with Prechter’s analyses, that created the revival of Elliott wave theory. I first read it in 1984, and it has had a profound influenced on my thinking about markets ever since.
Second, I’ve found Visual Guide to Elliott Wave Trading by Wayne Gorman and Jeffrey Kennedy, both of EWI, to be a useful book that relates Elliott wave theory to practical trading. The authors are hands-on Elliotticians, and for an active trader, that’s exactly what’s needed — less theory and more how-to. The first chapter of the book gives a very nice thumbnail run down of what Elliott wave theory is all about.
Terminology. Here are some links to information about some of the technical jargon I use.
Charts. On my charts, waves have a subscript showing the degree above or below the Intermediate degree. Here are the subscripts and the degree each represents:
- {+3} Supercycle
- {+2} Cycle
- {+1} Primary
- No subscript: Intermediate
- {-1} Minor
- {-2} Minute
- {-3} Minuette
- {-4} Subminuette
- {-5} Micro
- {-6} Submicro
- {-7} Minuscule
- {-8} Subminuscule
- {-9} Bitsy
- {-10} Subbitsy
By Tim Bovee, Portland, Oregon, May 21, 2021
Disclaimer
Tim Bovee, Private Trader tracks the analysis and trades of a private trader for his own accounts. Nothing in this blog constitutes a recommendation to buy or sell stocks, options or any other financial instrument. The only purpose of this blog is to provide education and entertainment.
No trader is ever 100 percent successful in his or her trades. Trading in the stock and option markets is risky and uncertain. Each trader must make trading decisions for his or her own account, and take responsibility for the consequences.
License
All content on Tim Bovee, Private Trader by Timothy K. Bovee is licensed under a Creative Commons Attribution-ShareAlike 4.0 International License.
Based on a work at www.timbovee.com.

You must be logged in to post a comment.