3:30 p.m. New York time
Half an hour before the closing bell. The S&P 500 rose slightly during the trading day, so far to 4206.25 on the futures and 4209.52 on the index. No change in the analysis. Chart updated.
10:15 a.m. New York time
What’s happening now? The S&P 500 E-mini futures rose slightly in overnight trading, to 4182.50, remaining below Friday’s high of 4185.
What does it mean? Friday’s high fulfilled the requirements for the correction that began May 13 from 4029.25; and my labeling of the chart reflects that interpretation. Under this scenario, the end of the correction will be followed by an energetic decline, the middle portion of a larger downtrend that began on May 9 from 4238.25.
What are the alternatives? There are three, all of nearly equal likelihood with my principle analysis.
- The upward correction is not yet complete.
- The correction will take a compound form.
- The downtrend that began on May 9 is instead a large-scale correction of the rise that began March 4.
I describe each in greater detail in the Elliott wave theory section, below.
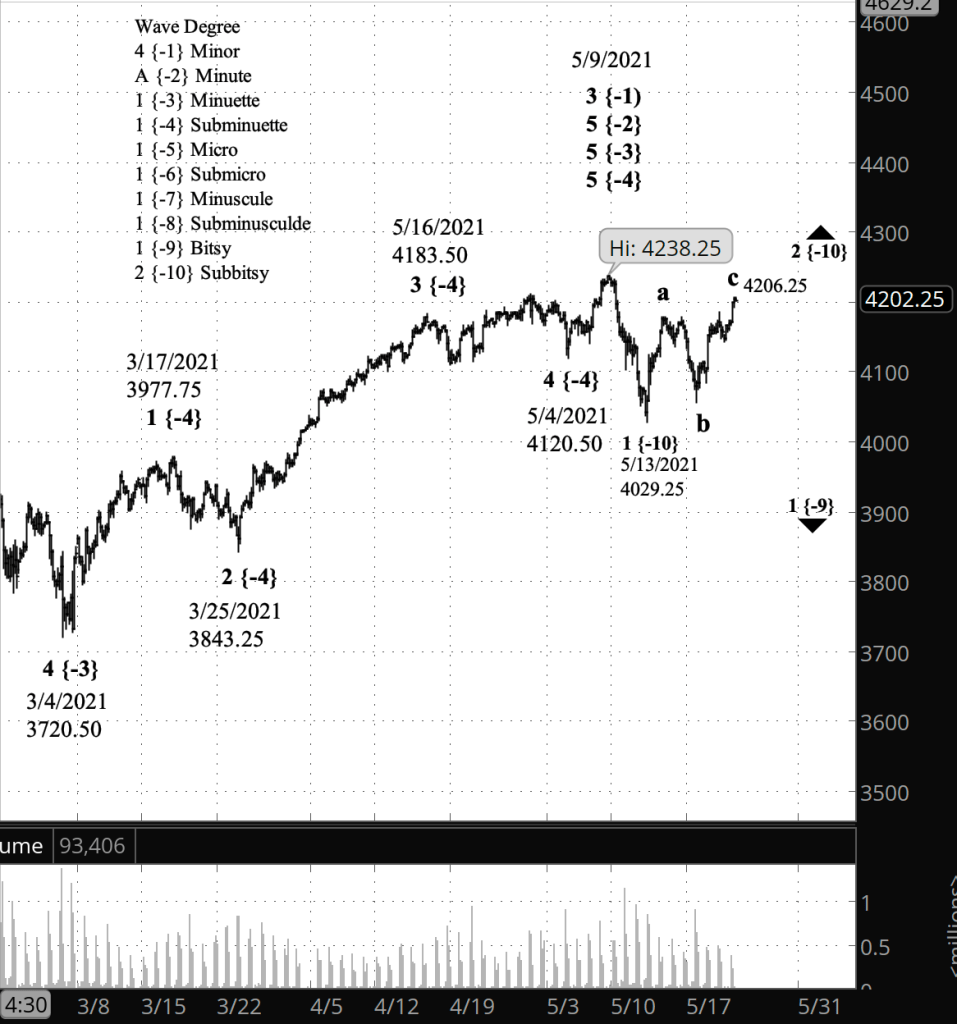
What does Elliott wave theory say? Under the principle analysis, an uptrending correction, wave 2 of Bitsy degree, was completed by last Friday’s high (4185 on May 21), and begun its 3rd wave, an energetic decline that will move beyond the end of the preceding wave 1, 4029.25. It is that move below the end of wave 1 that will confirm this analysis.
The alternatives:
- Although Friday’s high fulfills all requirements for wave 2, there’s no guarantee that it won’t move higher. For this alternative to be correct, the price must remain below the start of wave 1 on May 9, from 4238.25.
- Usually, compound wave forms are an occurrence in 4th waves, but 2nd-wave compounding isn’t unheard of. Under this scenario, the present peak will be followed by a shallow decline, an X wave that will separate the first corrective pattern from a second corrective pattern, the latter taking the form of a Zigzag, a Flat or a Triangle.
- This kicks in if the present rise moves above the start of wave 1, 4238.25. It means that the wave 1 decline should be labeled wave A of Bitsy degree, followed by a rising wave B rise (labelled “a” on the chart, which tracks the principle analysis), and then a falling wave C (labelled “b” in the principle analysis). The rise from the end of wave C are the early portions of a rise that will continue the uptrend that began on March 4. wave 5 of Minuette degree. I consider this to be the least likely alternative, based on the wave count prior to the May 9 high, but it’s not an impossibility.
So we’re at a complex turning point. Elliott wave analysis describes the possible paths that lie ahead, but doesn’t predict which path actually will lead us forward.
Learning and other resources. Elliott Wave International has long been the leading analytical house based on Elliott wave theory. They make available a number of free educational materials and other resources, in addition to their for-pay subscriptions.
I recommend two books, both by people associated with EWI.
First, Elliott Wave Principle by Robert Prechter and A.J. Frost is the book that, along with Prechter’s analyses, that created the revival of Elliott wave theory. I first read it in 1984, and it has had a profound influenced on my thinking about markets ever since.
Second, I’ve found Visual Guide to Elliott Wave Trading by Wayne Gorman and Jeffrey Kennedy, both of EWI, to be a useful book that relates Elliott wave theory to practical trading. The authors are hands-on Elliotticians, and for an active trader, that’s exactly what’s needed — less theory and more how-to. The first chapter of the book gives a very nice thumbnail run down of what Elliott wave theory is all about.
Terminology. Here are some links to information about some of the technical jargon I use.
Charts. On my charts, waves have a subscript showing the degree above or below the Intermediate degree. Here are the subscripts and the degree each represents:
- {+3} Supercycle
- {+2} Cycle
- {+1} Primary
- No subscript: Intermediate
- {-1} Minor
- {-2} Minute
- {-3} Minuette
- {-4} Subminuette
- {-5} Micro
- {-6} Submicro
- {-7} Minuscule
- {-8} Subminuscule
- {-9} Bitsy
- {-10} Subbitsy
By Tim Bovee, Portland, Oregon, May 24, 2021
Disclaimer
Tim Bovee, Private Trader tracks the analysis and trades of a private trader for his own accounts. Nothing in this blog constitutes a recommendation to buy or sell stocks, options or any other financial instrument. The only purpose of this blog is to provide education and entertainment.
No trader is ever 100 percent successful in his or her trades. Trading in the stock and option markets is risky and uncertain. Each trader must make trading decisions for his or her own account, and take responsibility for the consequences.
License
All content on Tim Bovee, Private Trader by Timothy K. Bovee is licensed under a Creative Commons Attribution-ShareAlike 4.0 International License.
Based on a work at www.timbovee.com.

[…] does it mean? The correction that began on May 13 from 4029.25 continues. In yesterday’s post I gave detailed analysis of the implications of the chart, along with three alternative […]
LikeLike