3:30 p.m. New York time
Half an hour before the closing bell. The S&P 500 continued to decline from its overnight peak of 4212.75. The further the decline from that price, the stronger the argument in favor of the peak being the end of wave 2 of Subbitsy degree and the beginning of wave 3 to the downside. The alternative analyses are that the decline from the peak is an X-wave separator within wave 2, which would be starting a complex pattern. Or the decline could be a small downtrend within the continuing rise of wave c within wave 2 of Subbitsy degree. Chart updated.
9:40 a.m. New York time
What’s happening now? The S&P 500 E-mini futures continued a slow rise in overnight trading, reaching a high of 4212.75 before the opening bell.
What does it mean? The correction that began on May 13 from 4029.25 continues. In yesterday’s post I gave detailed analysis of the implications of the chart, along with three alternative interpretations. That analysis still stands, with a slightly higher high.
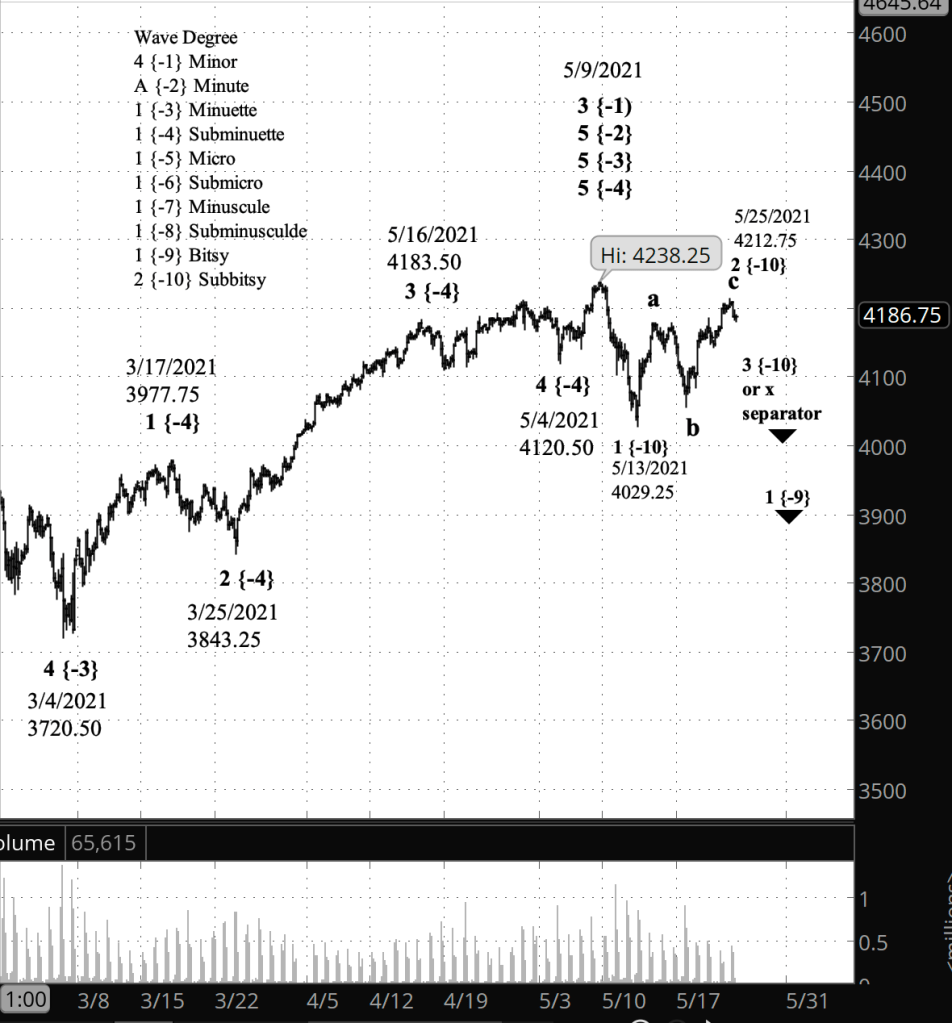
What does Elliott wave theory say? Wave c within wave 2 of Subbitsy degree continues. See yesterday’s post for a detailed discussion of the waves.
My trades. Under my trading rules, today marks the beginning of the entry period for options expiring July 16, with June 1 being the optimal entry date, 45 days prior to expiration. I’ll be assessing prospects beginning today.
Learning and other resources. Elliott Wave International has long been the leading analytical house based on Elliott wave theory. They make available a number of free educational materials and other resources, in addition to their for-pay subscriptions.
I recommend two books, both by people associated with EWI.
First, Elliott Wave Principle by Robert Prechter and A.J. Frost is the book that, along with Prechter’s analyses, that created the revival of Elliott wave theory. I first read it in 1984, and it has had a profound influenced on my thinking about markets ever since.
Second, I’ve found Visual Guide to Elliott Wave Trading by Wayne Gorman and Jeffrey Kennedy, both of EWI, to be a useful book that relates Elliott wave theory to practical trading. The authors are hands-on Elliotticians, and for an active trader, that’s exactly what’s needed — less theory and more how-to. The first chapter of the book gives a very nice thumbnail run down of what Elliott wave theory is all about.
Terminology. Here are some links to information about some of the technical jargon I use.
Charts. On my charts, waves have a subscript showing the degree above or below the Intermediate degree. Here are the subscripts and the degree each represents:
- {+3} Supercycle
- {+2} Cycle
- {+1} Primary
- No subscript: Intermediate
- {-1} Minor
- {-2} Minute
- {-3} Minuette
- {-4} Subminuette
- {-5} Micro
- {-6} Submicro
- {-7} Minuscule
- {-8} Subminuscule
- {-9} Bitsy
- {-10} Subbitsy
By Tim Bovee, Portland, Oregon, May 25, 2021
Disclaimer
Tim Bovee, Private Trader tracks the analysis and trades of a private trader for his own accounts. Nothing in this blog constitutes a recommendation to buy or sell stocks, options or any other financial instrument. The only purpose of this blog is to provide education and entertainment.
No trader is ever 100 percent successful in his or her trades. Trading in the stock and option markets is risky and uncertain. Each trader must make trading decisions for his or her own account, and take responsibility for the consequences.
License
All content on Tim Bovee, Private Trader by Timothy K. Bovee is licensed under a Creative Commons Attribution-ShareAlike 4.0 International License.
Based on a work at www.timbovee.com.

You must be logged in to post a comment.