3:30 p.m. New York time
Half an hour before the closing bell. The S&P 500 recovered much of its overnight decline, reaching 4202.50 on the futures. The price remained below the overnight high. I have no change to the analysis and have updated the chart.
9:35 a.m. New York time
What’s happening now? The S&P 500 E-mini futures declined sharply in overnight trading, down to a low of 4169.50 before the opening bell.
What does it mean? The further the decline, the greater the confirmation of yesterday’s principle analysis: The June 1 peak of 4230 marked the end of the upward correction that began on May 13 from 4029.25, and the downtrend that began on May 9 from 4238.25 has resumed.
What’s the alternative? It is possible that the correction is still underway. Given the overnight decline, I consider this to be the less likely analysis. A rise above the June 1 high of 4230 would confirm this alternate analysis.
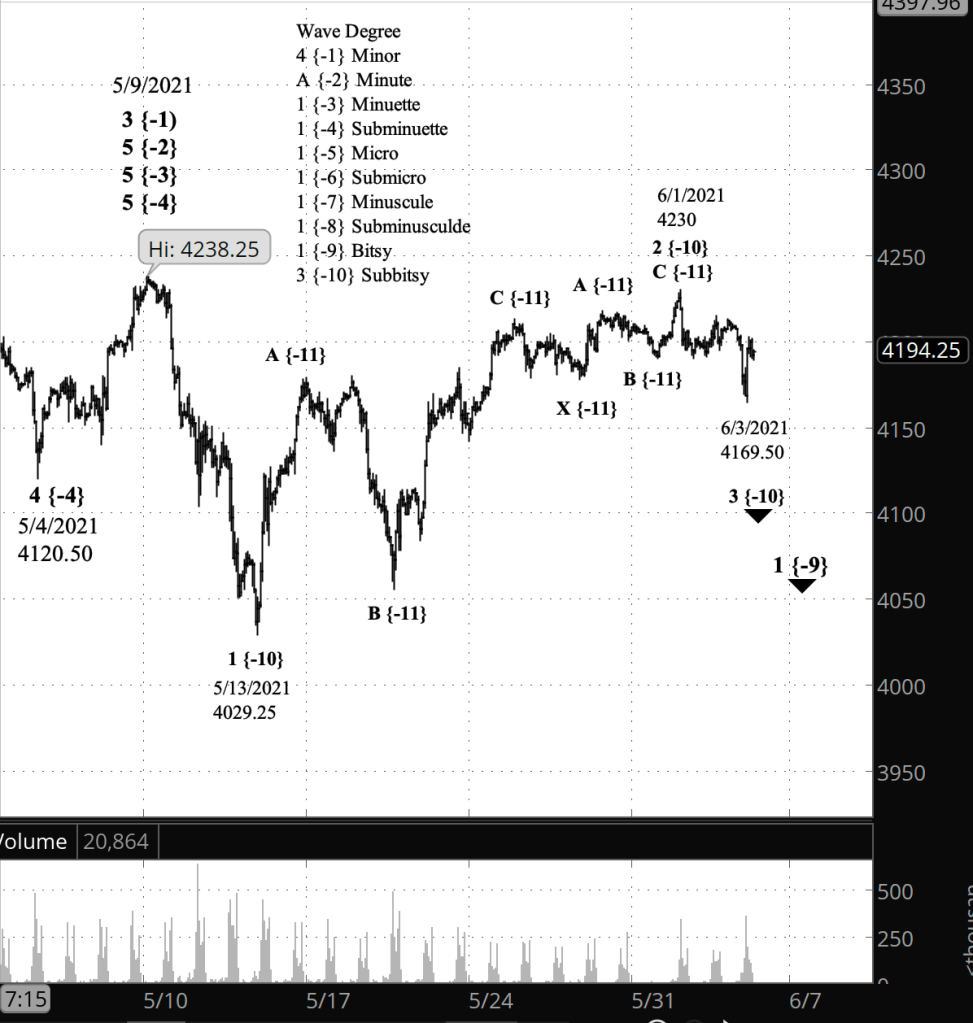
What does Elliott wave theory say? Under my principle analysis, wave 2 of Subbitsy degree ended on June 1 and Subbitsy wave 3 began. Third waves tend to have a lot energy — the sort of thing that makes market analysts perk up and start talking about the end of a bull market — and this wave 3 will carry the price below 4029.25, the end of the preceding 1st wave, perhaps significantly below.
This is all happening within wave 1 of Bitsy degree, a small step in the large-degree downtrend that began on May 9. The May 9 peak was the end of wave 5 of Minute degree, which began on October 30, 2020 from 3225. The Minute degree is eight degrees larger than Subbitsy degree, so it’s a big deal. Under this analysis I expect the price to work its way down to the 3200s and below. But never in a straight line. The market always is fractal in its nature, showing trends and corrections within larger trends and corrections, from the largest to the smallest moves.
Under the alternative analysis, the Subbitsy wave 2 correction is still underway, and the price can be expected to reverse, returning to the 4200s as the correction continues on its course. However, there is a limit: If the price moves above the start of the preceding 1st wave, 4238.25, then the entire analysis is tossed out as invalid, and the large-degree uptrend that has been going on for more than a year is still underway.
Learning and other resources. See the menu page Analytical Methods for a rundown on where to go for information on Elliott wave analysis.
By Tim Bovee, Portland, Oregon, June 2, 2021
Disclaimer
Tim Bovee, Private Trader tracks the analysis and trades of a private trader for his own accounts. Nothing in this blog constitutes a recommendation to buy or sell stocks, options or any other financial instrument. The only purpose of this blog is to provide education and entertainment.
No trader is ever 100 percent successful in his or her trades. Trading in the stock and option markets is risky and uncertain. Each trader must make trading decisions for his or her own account, and take responsibility for the consequences.
License
All content on Tim Bovee, Private Trader by Timothy K. Bovee is licensed under a Creative Commons Attribution-ShareAlike 4.0 International License.
Based on a work at www.timbovee.com.

You must be logged in to post a comment.