3:30 p.m. New York time
Half an hour before the closing bell. The S&P 500 spent the day barely budging as it remained below the overnight high. of 4236.75. I have no change to my analysis. I’ve updated the chart.
10:20 a.m. New York time
What’s happening now? The S&P 500 E-mini futures rose further still in overnight trading, reaching 4236.75 before pulling back slightly. That overnight high is within a point and a half of the starting point of the downtrend that began on May 9 from 4238.25. The dotted red line on the chart shows the 4238.25 level.
What does it mean? As long as the price doesn’t exceed 4238.25, then my principle analysis stands: The decline from May 9 is the beginning of a new downtrend that will eventually carry the price down to the low 2000s or below. The rise that began on May 13 is a correction within that larger downtrend.
What’s the alternative? If the price moves above 4238.25, then the decline from May 9 marked the start of a correction within an ongoing uptrend that began on February 23, 2020. That correction has ended and the uptrend has resumed.
A complication. The S&P 500 futures, which trade continually except for a break on weekends, are a derivative of the S&P 500 index, which trades only during normal market hours in New York. So while the futures are within a hair’s breadth of the May 9 high, the index price isn’t as close. The May 9 high on the index was 4238.04, and the subsequent high was 4234.12 on June 1, a distance of 3.92 points.
So what to do if the futures reach a new all-time high but the index does not? Although the futures are derived from the index, they are separate products, and I shall analyze them separately.
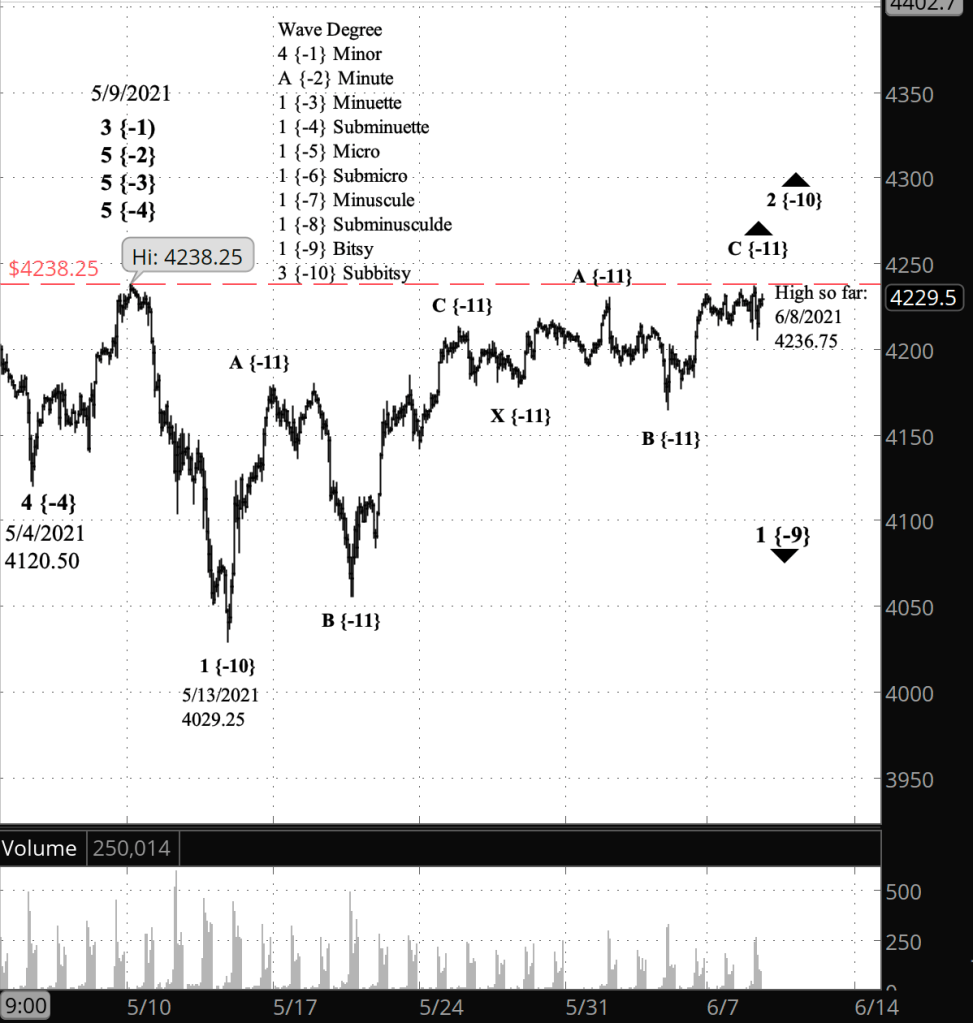
What does Elliott wave theory say? The May 9 peak ended wave 5 of Subminuette degree, which on the futures began from 3525.50 on October 30, 2020 and a series of 5th waves of higher degree up to wave 3 of Minor degree, which began on February 23, 2020 from 2191.96 on the index.
Under my principle analysis, the present rise wave C within wave 2 of Subbitsy degree with declining wave 1 of Bitsy degree, all within wave 4 of Minor degree.
If the futures exceed 4238.25, then the present rise will be a 1st wave rise of low degree within a continuing wave 5 of Subminuette degree — maybe. I’m not entirely sure how the count will run if that level is exceeded.
Learning and other resources. See the menu page Analytical Methods for a rundown on where to go for information on Elliott wave analysis.
By Tim Bovee, Portland, Oregon, June 8, 2021
Disclaimer
Tim Bovee, Private Trader tracks the analysis and trades of a private trader for his own accounts. Nothing in this blog constitutes a recommendation to buy or sell stocks, options or any other financial instrument. The only purpose of this blog is to provide education and entertainment.
No trader is ever 100 percent successful in his or her trades. Trading in the stock and option markets is risky and uncertain. Each trader must make trading decisions for his or her own account, and take responsibility for the consequences.
License
All content on Tim Bovee, Private Trader by Timothy K. Bovee is licensed under a Creative Commons Attribution-ShareAlike 4.0 International License.
Based on a work at www.timbovee.com.

You must be logged in to post a comment.