3:30 p.m. New York time
Half an hour before the closing bell. The S&P 500 continued to trade below yesterday’s high. No change in the analysis. Price updated.
9:40 a.m. New York time
What’s happening now? The S&P 500 E-mini futures slid sideways in overnight trading, remaining below yesterday’s high of 4236.75.
What does it mean? As long as the price remains below the May 9 high of 4238.25, then my principle analysis is that the correction that began on that date is still underway.
What’s the alternative? A move above 4238.25 triggers the alternative count, that the uptrend that began on February 23, 2020 is still underway.
Why is the price going nowhere? An old mentor of mine described it this way: When a price stalls, it’s because people wanting to buy and those wanting to sell have reached an equilibrium. The price will rise further only when people have a greater desire to buy compared to people wanting to sell, and the reverse to trigger a price decline.
People holding S&P 500 positions saw the value of their holdings decline by 4.9% between May 9 and May 13.The present price is a 5.1% rise from May 13 and stands just below the breakeven point. It seems reasonable that some people, spooked by the decline, want to get out before a bigger decline begins. Others, encouraged by the rise, want to hold their positions in the expectation of a break back into profitability. Eventually, one group or the other will gain sufficient numbers to move the price. The present Elliott wave analysis suggests that the decline group will win, but Elliott provides context, not prophecy.
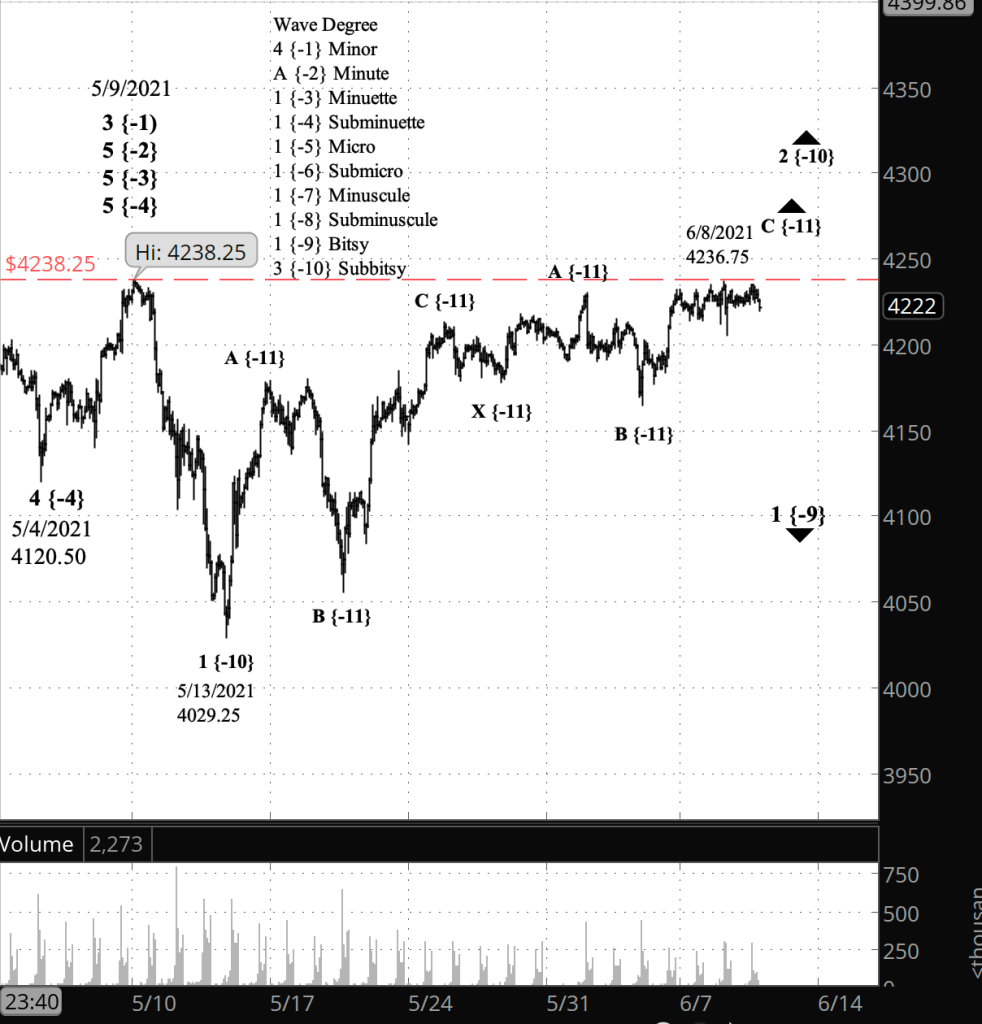
What does Elliott wave theory say? Under my principle analysis, the rise from May 13 is wave 2 of Subbitsy degree, and internally it is nearing the end of a wave C. From that point, it will either decline in separator wave and then add a third corrective pattern to the compound correction. Or it will decline to below 4029.25, confirming that the downtrend is underway.
Under the alternative analysis, the price will move above 4238.25 in a continuation of wave 5 of Subminuette degree.
Learning and other resources. See the menu page Analytical Methods for a rundown on where to go for information on Elliott wave analysis.
By Tim Bovee, Portland, Oregon, June 9, 2021
Disclaimer
Tim Bovee, Private Trader tracks the analysis and trades of a private trader for his own accounts. Nothing in this blog constitutes a recommendation to buy or sell stocks, options or any other financial instrument. The only purpose of this blog is to provide education and entertainment.
No trader is ever 100 percent successful in his or her trades. Trading in the stock and option markets is risky and uncertain. Each trader must make trading decisions for his or her own account, and take responsibility for the consequences.
License
All content on Tim Bovee, Private Trader by Timothy K. Bovee is licensed under a Creative Commons Attribution-ShareAlike 4.0 International License.
Based on a work at www.timbovee.com.

You must be logged in to post a comment.