3:30 p.m. New York time
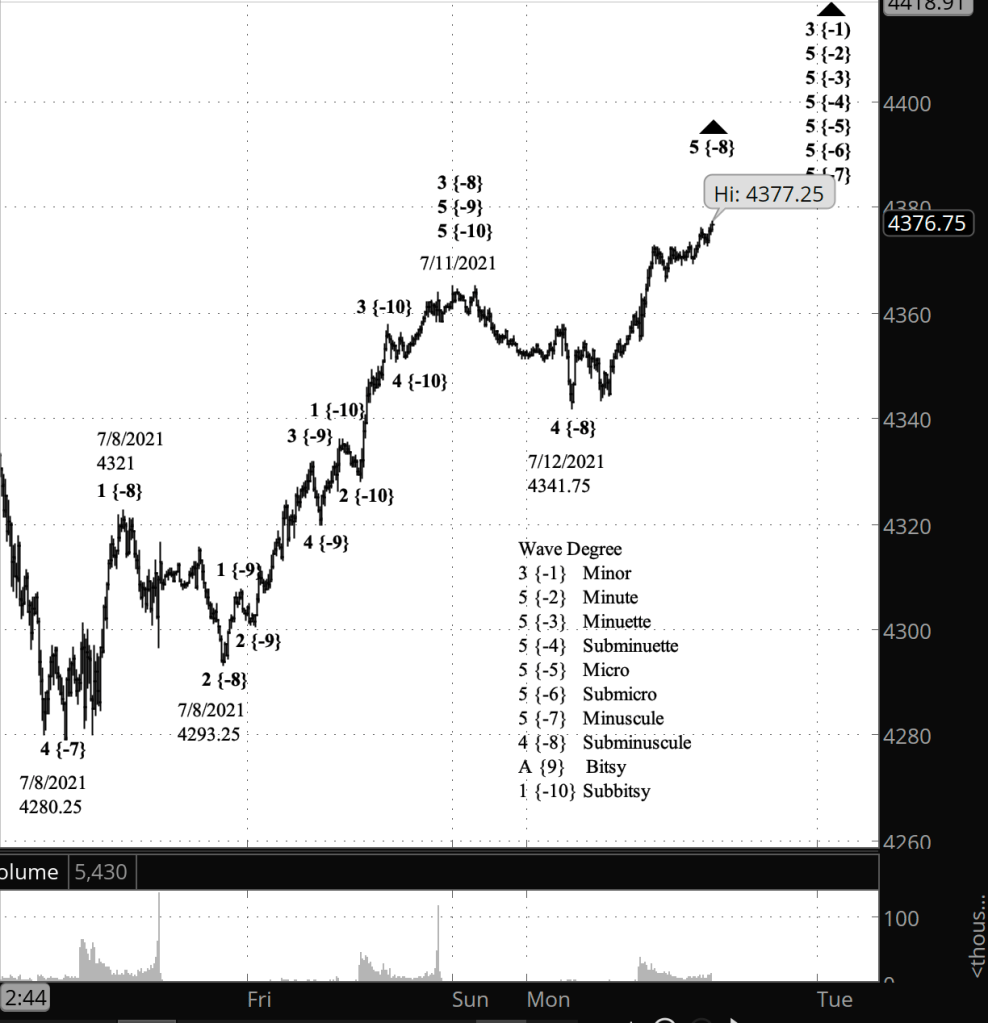
Half an hour before the closing bell. The S&P 500 continued to rise, reaching a high of 4377.25 on the futures and 4385.57 on the index. Afterward it continued to trade just below the highs. Wave 5 of Subminuscule degree is still underway. I’ve updated the top chart of the two posted earlier today.
11:10 a.m. New York time
Price follows alternative path. My alternative analysis has proven correct, as the price moved to a new high after the opening bell. Wave 5 of Subminuscule degree is underway. Here’s a chart with the revised count. I’ve retained the chart I posted this morning so that the changes are apparent.
9:45 a.m. New York time
What’s happening now? The S&P 500 E-mini futures moved to a new high of 4365.25 after trading resumed on Sunday, and then reversed, reaching a low of 4341.75. The price then reversed to the upside but remained below Sunday’s peak.
What does it mean? The decline from Sunday’s peak is a shallow correction within the small rise that began on July 8 from 4280.25, the last leg of a very large rise that began in February 2020. The present rise within the correction will be followed by a further decline, possibly completing the correction, which will be followed by a push up to new highs. I say “possibly” because the correction could prove to be a complex pattern, pasting several simple corrective patterns together.
What’s the alternative? If the present rise moves above Sunday’s high, then the early morning low of 4341.75 marks the end of the correction, and the push to higher highs has already begun.
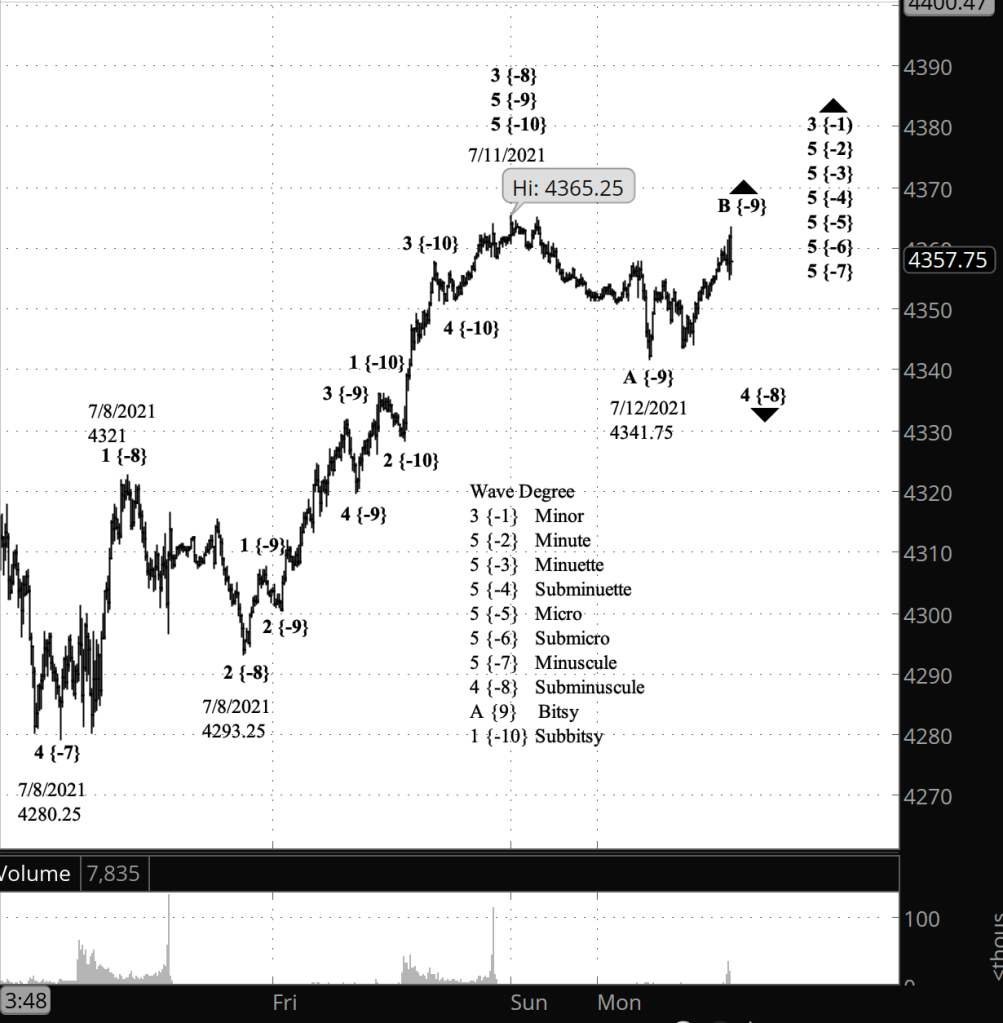
What does Elliott wave theory say? In the chart I’ve moved in close to see the detailed wave count within wave 5 of Minuscule degree, which began on July 8 from 4280.25. Within Minuscule 5, Sunday’s peak, 4365.25, marked the end of wave 3 of Subminuscule degree and the beginning of Subminuscule wave 4, a correction that appears to be taking a Flat pattern. One common occurrence in 4th waves is that they extend into complex patterns. The basic corrective pattern is three waves, and a complex correction consists of a basic pattern, a connector wave, and then another basic pattern. Sometimes the correction will go on to a third corrective pattern.
Within Subminuscule 4, the A wave of Bitsy degree, to the downside, ended at 4341.75 and the B wave of Bitsy degree, to the upside, is still underway. Bitsy wave B must remain below the beginning of the parent 4th wave’s starting point of 4365.25.
If the price in fact moves above the 4th wave’s starting point, then the alternative analysis kicks in; what I have labeled as wave A becomes the end of wave 4 of Subminuscule degree, and the rise from that point is an ongoing wave 5 of Subminuscule degree. I consider this alternative to be less likely.
Learning and other resources. See the menu page Analytical Methods for a rundown on where to go for information on Elliott wave analysis.
By Tim Bovee, Portland, Oregon, July 12, 2021
Disclaimer
Tim Bovee, Private Trader tracks the analysis and trades of a private trader for his own accounts. Nothing in this blog constitutes a recommendation to buy or sell stocks, options or any other financial instrument. The only purpose of this blog is to provide education and entertainment.
No trader is ever 100 percent successful in his or her trades. Trading in the stock and option markets is risky and uncertain. Each trader must make trading decisions for his or her own account, and take responsibility for the consequences.
License
All content on Tim Bovee, Private Trader by Timothy K. Bovee is licensed under a Creative Commons Attribution-ShareAlike 4.0 International License.
Based on a work at www.timbovee.com.

[…] under way, as are its child waves — 5th waves down to Minuscule degree and lower. See the top chart in yesterday’s analysis for a sense of what that labeling would look […]
LikeLike