3:30 p.m. New York time
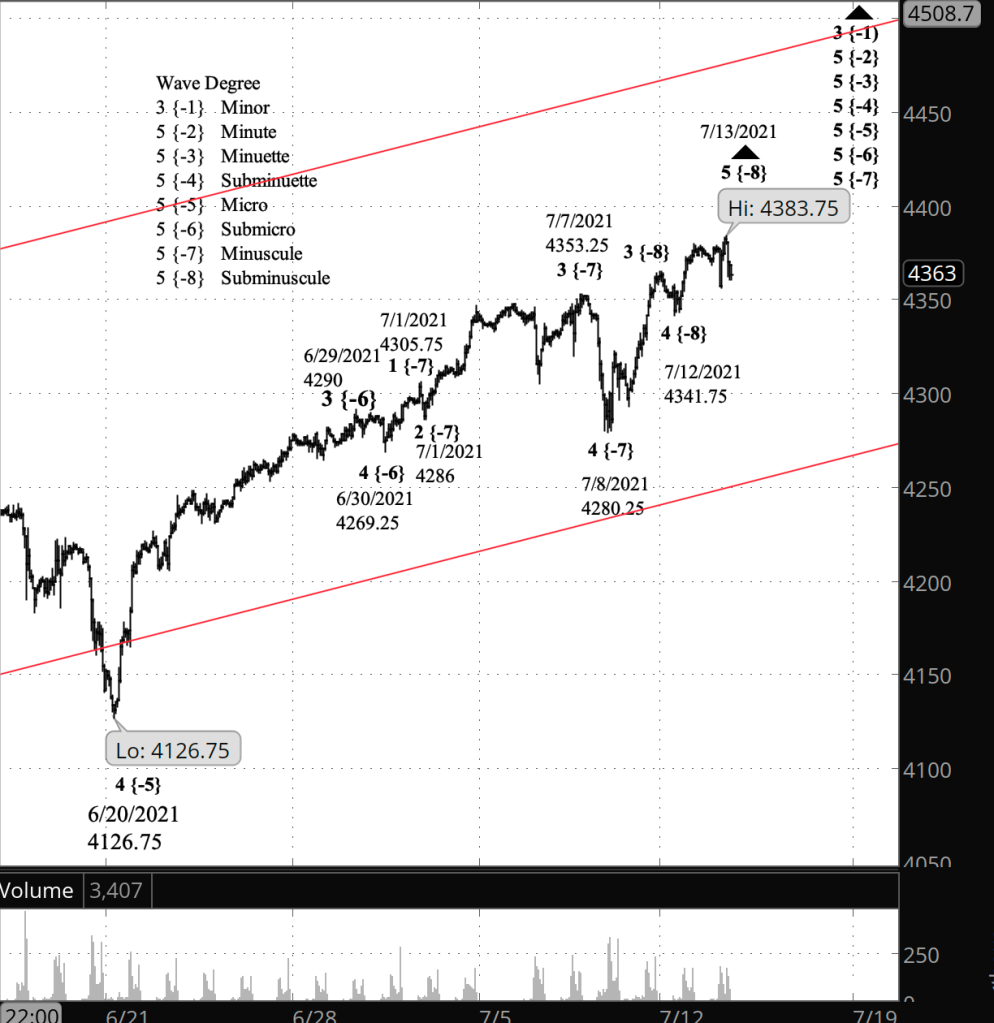
Half an hour before the closing bell. The S&P 500, having set a new high in the morning, has drawn back, trading more than 20 points below the peak. No change in the analysis. I’ve updated the top chart.
10:55 a.m. New York time
Alternative analysis wins. Well, that was fast. The S&P 500 E-mini futures reversed course and rose to a new high, meaning that the alternative analysis is the correct one. Wave 5 of Subminuscule degree and 5th waves up Minute degree are still underway, as is wave 3 of Minor degree.
9:55 a.m. New York time
What’s happening now? The S&P 500 E-mini futures sharply reversed from Monday’s high of 4379.25.
What does it mean? Same song different verse. If the price remains below Monday’s high, then that level marks the end of the rise from June 20 and indeed the end of the rise that began on February 23, 2020. If it moves below Monday’s low of 4341.75, then the odds strengthen that a major downtrend has begun.
What’s the alternative? If the price reverses and moves above Monday’s high to a still higher high, then the rise that began on June 20 and indeed in February of last year is still underway.
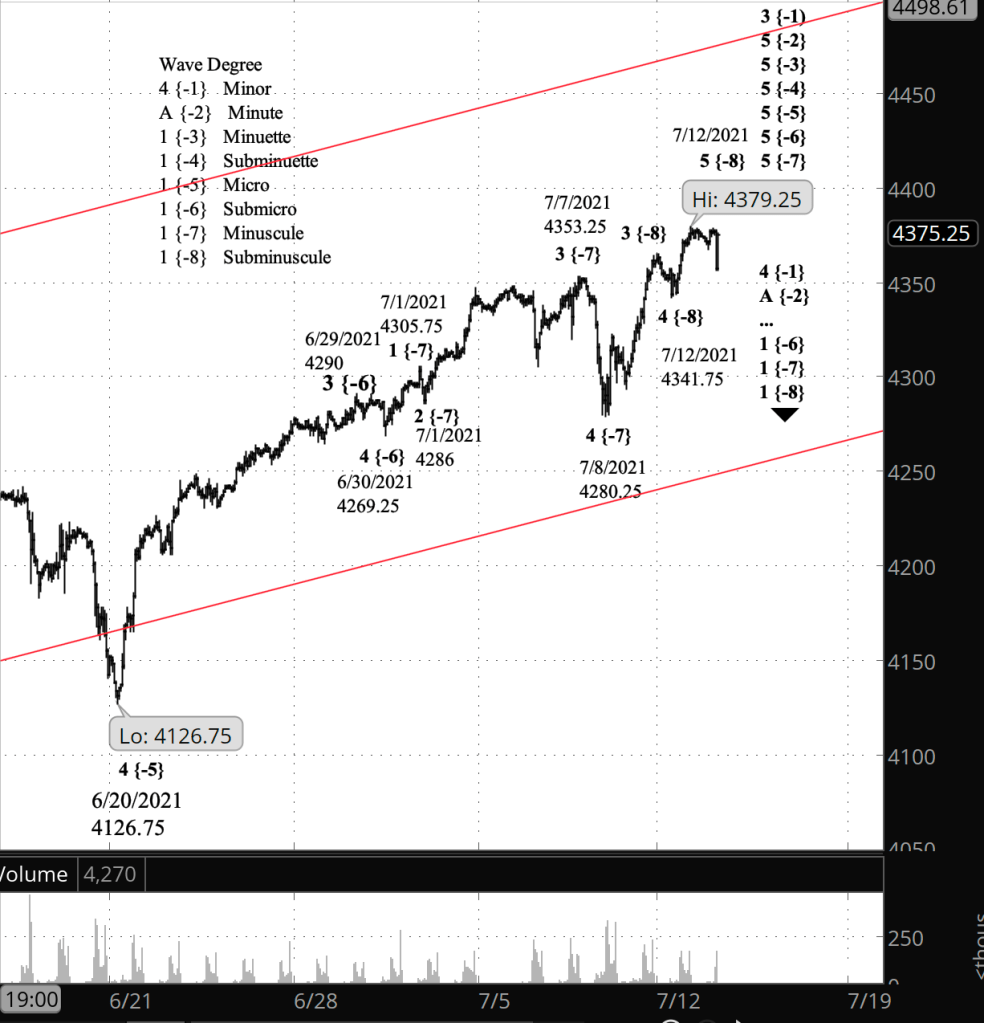
What does Elliott wave theory say? I’ve marked the chart according to the principle analysis, although at this point, I find it impossible to choose between it and the alternative analysis.
Under the principle analysis, Monday’s high of 4379.25 marks the end of wave 5 of Subminuscule degree, and indeed of parent 5th waves up six degrees to Minute degree. Up one degree further, the peak marks the end of wave 3 of Minor degree, which began on February 23, 2020 from 2191.86 on the index and somewhere close to that level on the futures.
The ensuing decline is the start of wave 4 of Minor degree, a shallow correction that commonly takes the form of a Flat, although there are other possibilities. Fourth waves typically end with the price range of wave 4 within the preceding wave 3; in this case, wave 4 of Minute degree within wave 3 of Minor degree. The price range on the index is from 3588.11 down to 3233.95, levels set in September and October of last year.
Under the alternative analysis, a move of the price above Monday’s high of 4379.25 means that wave 3 of Minor degree is still under way, as are its child waves — 5th waves down to Minuscule degree and lower. See the top chart in yesterday’s analysis for a sense of what that labeling would look like.
Under the alternative analysis, there is no limit on how high the price can rise; fifth waves have a tendency to extend, sometimes to an extraordinary length.
Bottom line, we are back in ambiguity and won’t know which analysis turns out to be correct until the price tells us.
Learning and other resources. See the menu page Analytical Methods for a rundown on where to go for information on Elliott wave analysis.
By Tim Bovee, Portland, Oregon, July 13, 2021
Disclaimer
Tim Bovee, Private Trader tracks the analysis and trades of a private trader for his own accounts. Nothing in this blog constitutes a recommendation to buy or sell stocks, options or any other financial instrument. The only purpose of this blog is to provide education and entertainment.
No trader is ever 100 percent successful in his or her trades. Trading in the stock and option markets is risky and uncertain. Each trader must make trading decisions for his or her own account, and take responsibility for the consequences.
License
All content on Tim Bovee, Private Trader by Timothy K. Bovee is licensed under a Creative Commons Attribution-ShareAlike 4.0 International License.
Based on a work at www.timbovee.com.

You must be logged in to post a comment.