3:30 p.m. New York time
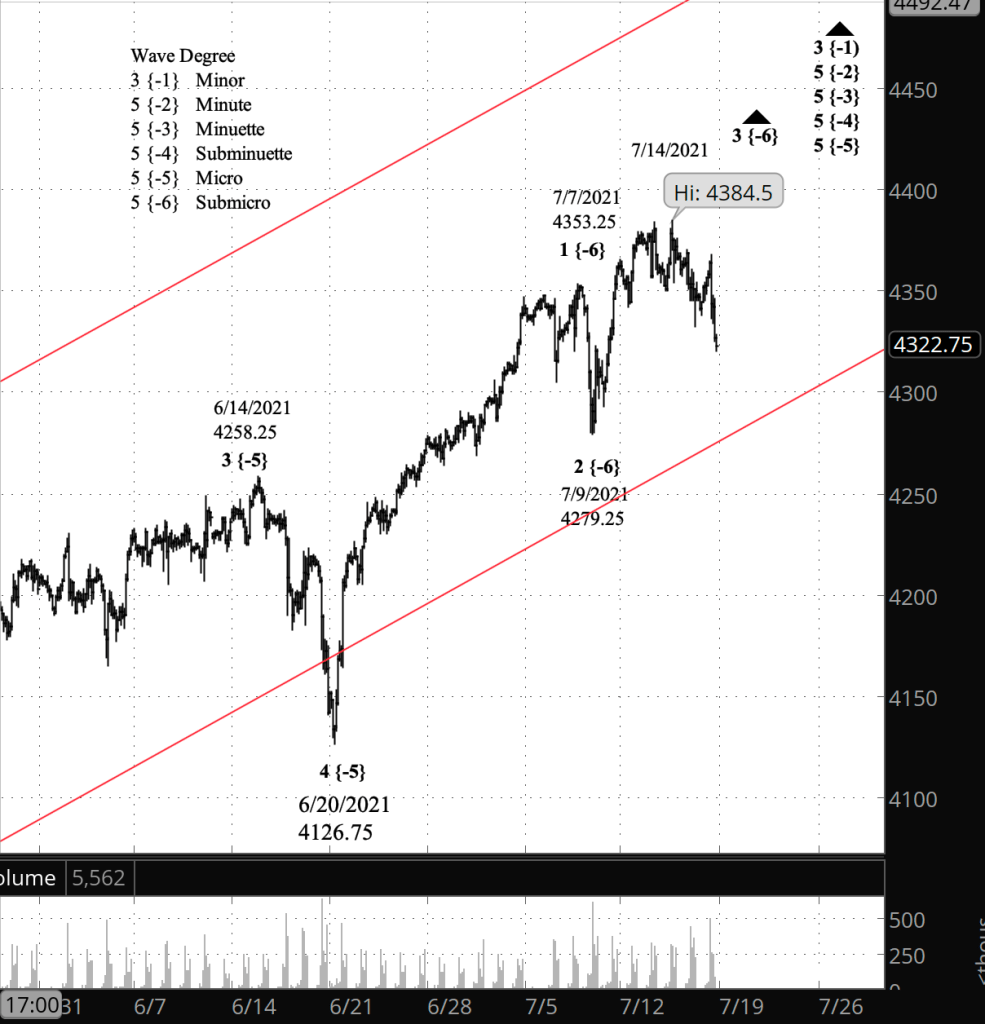
Half an hour before the closing bell. The S&P 500 fell throughout the day, reaching the low 4320s. I’m labeling the movements today as subwaves of a rising wave 3 of Submicro degree. One reason for considering Submicro 3 to still be underway is the brevity of that 3rd wave so far compared to the 1st wave that preceded it. Under Elliott wave theory, a 3rd wave can’t be shorter than both the 1st wave and the 5th wave of set, and indeed 3rds tend to be the longest of the three. But we’ll see what the chart does. This may be one of those atypical movements that make Elliott wave analysis interesting, and challenging.
I’ve updated the shorter-term (top) chart, below.
9:40 a.m. New York time
What’s happening now? The S&P 500 rose in the 4th leg of a small degree rise within a larger uptrend that began on June 20, which in turn is part of a far larger uptrend that began on February 23, 2020, with the price remaining below Wednesday’s high of 4384.50 on the E-mini futures, 4393.68 on the index.
What does it mean? The uptrends, both the smaller and the larger, have since April have been scraping along the upper boundary of an expanding Diagonal Triangle pattern that began on December 26, 2018, suggesting that the market, while still rising, will soon will be pull away and begin a downward journey to the lower boundary of the triangle, presently about 50 points above the 2000 level and falling.
What’s the alternative? It’s possible to count Wednesday’s high as the end of the uptrend from June 20, meaning the present decline is a correction of that rise, or even as the end of the uptrend from February 2020, meaning that the downward journey has already begun. Based on my work in yesterday’s analysis, I consider these to be the less likely interpretations of the chart.
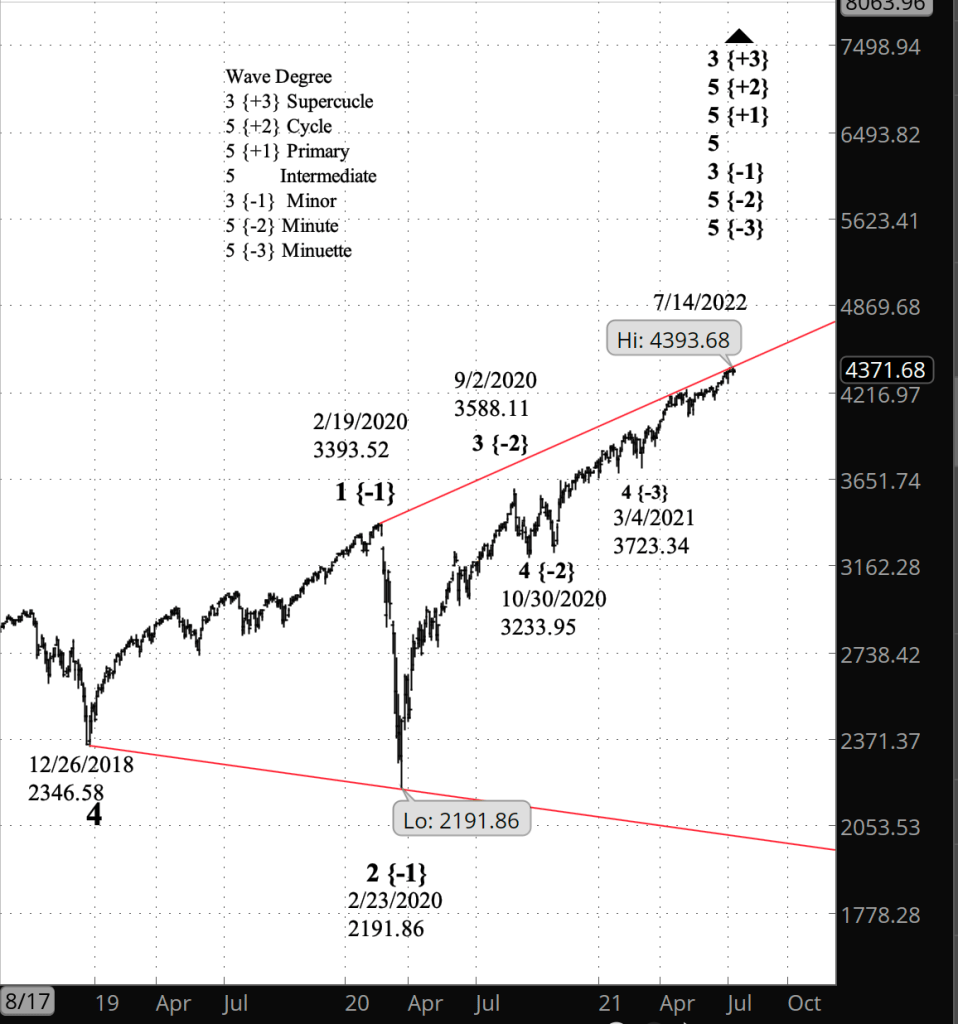
What does Elliott wave theory say? The upper boundary of the Diagonal Triangle, connecting the endpoints of waves 1 and 3 of Minor degree, gets bumped a bit higher and steeper with each new high of the S&P 500. In looking at the chart, I’m struck by the change in the angle of the price as it relates to the triangle boundary. Up until April the price was at an angle that brought it every closer to the triangle’s upper boundary. It was on the move. Since April, the price has mimicked the angle of the upper boundary — rising, to be sure, but doing little to push the 3rd wave endpoint of the boundary higher.
Intuitively, the chart looks like a rise that’s running out of steam, to use an old-fashioned phrase at one time much beloved by market commentators. In the terminology of Elliott wave analysis, my principle count has it that rising wave 3 of Submicro degree within wave of Micro degree is still underway. Submicro wave 3 will be followed by a shallow 4th wave correction, and then a final 5th wave push to the upside, completing the parent, Micro wave 5.
A rise to a new high will mean that Submicro 3 is still underway. A decline below the start of Submicro wave 3, from 4279.25 on the futures, will mean the completion of Subicro 3, which would in fact properly counted as Submicro wave 5, and would trigger a complete recount of the rise from June 20 and
The end of wave 5 of Micro degree, whenever it happens, will also mark the end of 5th waves up to Minute degree, four degrees larger, and of the 3rd wave of Minor degree (up one more degree).
Learning and other resources. See the menu page Analytical Methods for a rundown on where to go for information on Elliott wave analysis.
By Tim Bovee, Portland, Oregon, July 16, 2021
Disclaimer
Tim Bovee, Private Trader tracks the analysis and trades of a private trader for his own accounts. Nothing in this blog constitutes a recommendation to buy or sell stocks, options or any other financial instrument. The only purpose of this blog is to provide education and entertainment.
No trader is ever 100 percent successful in his or her trades. Trading in the stock and option markets is risky and uncertain. Each trader must make trading decisions for his or her own account, and take responsibility for the consequences.
License
All content on Tim Bovee, Private Trader by Timothy K. Bovee is licensed under a Creative Commons Attribution-ShareAlike 4.0 International License.
Based on a work at www.timbovee.com.

[…] the prior labeling in the upper chart of Friday’s SP500 post. As I noted on Friday, the length of wave 1 is troubling because under the rules of Elliott wave […]
LikeLike