3:30 p.m. New York time
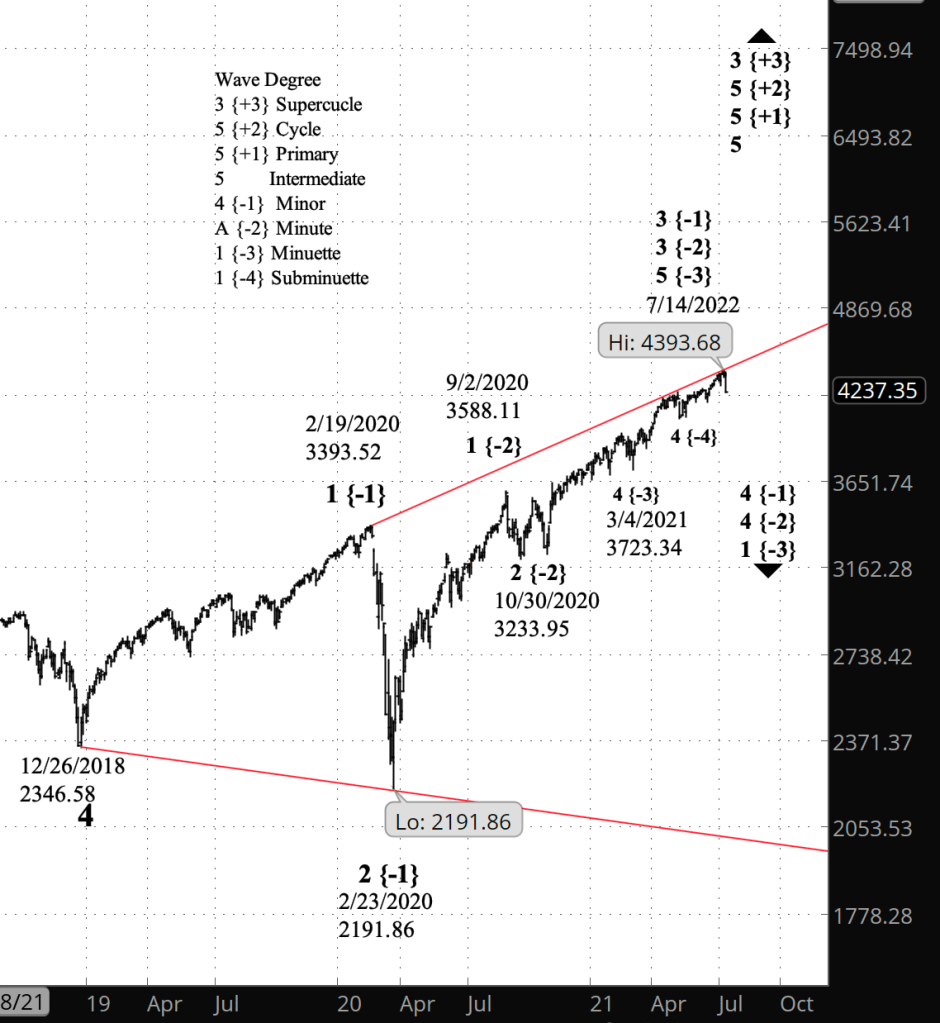
Half an hour before the closing bell. The S&P 500 continued to decline during the day, the futures reaching 4224 and the index, 4233.13. I’ve updated the near-term chart from this morning, and have added a long-term chart showing the expanding triangle that began in 2018 and is continuing.
9:50 a.m. New York time
What’s happening now? The S&P 500 E-mini futures fell sharply overnight, reaching below the lower boundary of the price channel that began in March, to a low of 4262.50 at the opening bell.
What does it mean? The power of the decline requires a re-analysis of the rise from June 20. Under my new principle count, the July 14 peak of 4384.50 marks the end of the uptrend that began on February 23, and the beginning of a significant downtrend.
What’s the alternative? If the price rises above 4384.50 then something else is going on, perhaps an expanding Diagonal Triangle.
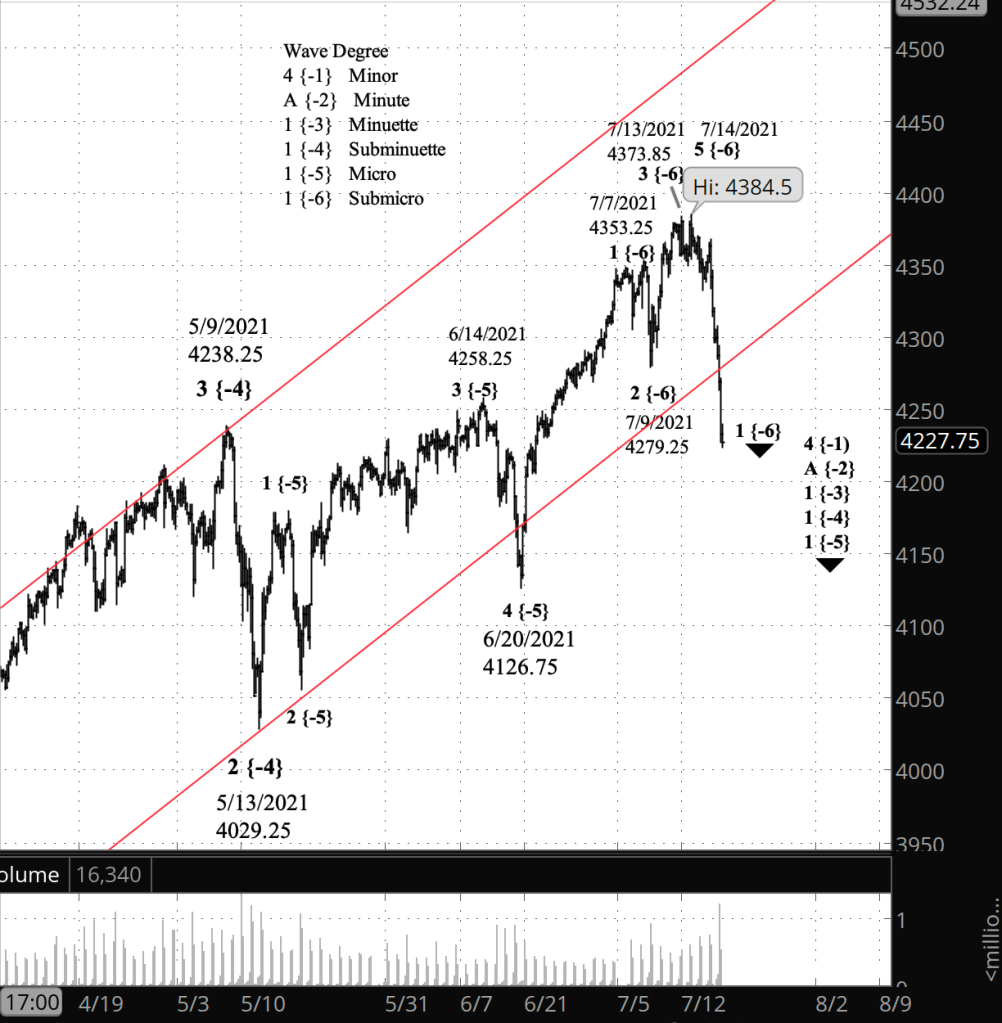
What does Elliott wave theory say? In re-analyzing the rise from June 20, I’ve made the following changes to the labelling on the chart:
- I’ve moved the end of wave 3 of Submicro degree to the July 13 high of 4373.85.
- I’ve labelled the peak of July 14 at 4384.5 as the end of wave 5 of Submicro degree.
- I’ve retained the unnaturally long wave 1 of Submicro degree, keeping its endpoint at 4353.25 on July 7.
See the prior labeling in the upper chart of Friday’s SP500 post. As I noted on Friday, the length of wave 1 is troubling because under the rules of Elliott wave analysis, the 3rd wave cannot be shorter than both wave 1 and wave 5. A long wave 1 suggests that there’s trouble down the road in finding a count that satisfies that rule.
The sharp decline suggests that the July 14 peak was the end of wave 5 of Submicro degree. That being the case, the best count that satisfies the Elliott wave rule on length is to end wave 1 on July 7, as with the earlier count. And to accept an unnaturally short wave 3 by ending it on July 13. And then to accept a very short 5th wave ending on July 14. That makes the 5th wave shorter than wave 3, satisfying the rule. Truncated 5th waves aren’t uncommon.
The end of wave 5 of Submicro degree cascades up the degrees, also marking the end of 5th waves of Micro, Minuette, Subminuette and Minute degrees, and also ending wave 3 of Minor degree, which began on February 23, 2020, the end of the early pandemic crash.
So the present decline, from July 14, becomes wave A of Minute degree within wave 4 of Minor degree, the beginning of a downtrend that will eventually reach an impressive scale. This 4th wave is part of an expanding Diagonal Triangle, and its target is the triangle’s lower boundary, now at 2038 and moving lower each day. (See the lower chart in Friday’s SP500 post.)
If the alternative analysis proves to be correct, then what we’re seeing is a smaller expanding Diagonal Triangle, at the Subminuette degree, beginning on July 20.
Learning and other resources. See the menu page Analytical Methods for a rundown on where to go for information on Elliott wave analysis.
By Tim Bovee, Portland, Oregon, July 19, 2021
Disclaimer
Tim Bovee, Private Trader tracks the analysis and trades of a private trader for his own accounts. Nothing in this blog constitutes a recommendation to buy or sell stocks, options or any other financial instrument. The only purpose of this blog is to provide education and entertainment.
No trader is ever 100 percent successful in his or her trades. Trading in the stock and option markets is risky and uncertain. Each trader must make trading decisions for his or her own account, and take responsibility for the consequences.
License
All content on Tim Bovee, Private Trader by Timothy K. Bovee is licensed under a Creative Commons Attribution-ShareAlike 4.0 International License.
Based on a work at www.timbovee.com.

You must be logged in to post a comment.