3:30 p.m. New York time
Half an hour before the closing bell. The S&P 500 E-mini futures continued to trade within a narrow range, staying above this morning’s low of 4365.25 and above the July 298 high of 4422.50.
My Trades. I entered two options positions today, expiring on September 17. They are on AMD and FXI.
Also, yesterday, I entered share positions on VB, ZBRA and ZM.
10:30 a.m. New York time
What’s happening now? The S&P 500 E-mini futures continued to draw back in overnight trading, reaching a low of 4367.25 today.
What does it mean? The rise that began on July 19 continues and since July 29 has been in an internal correction, after which the price will reach new highs.
What’s the alternative? The high of July 29 marked the end of the uptrend and a downtrend of a larger proportion has begun.
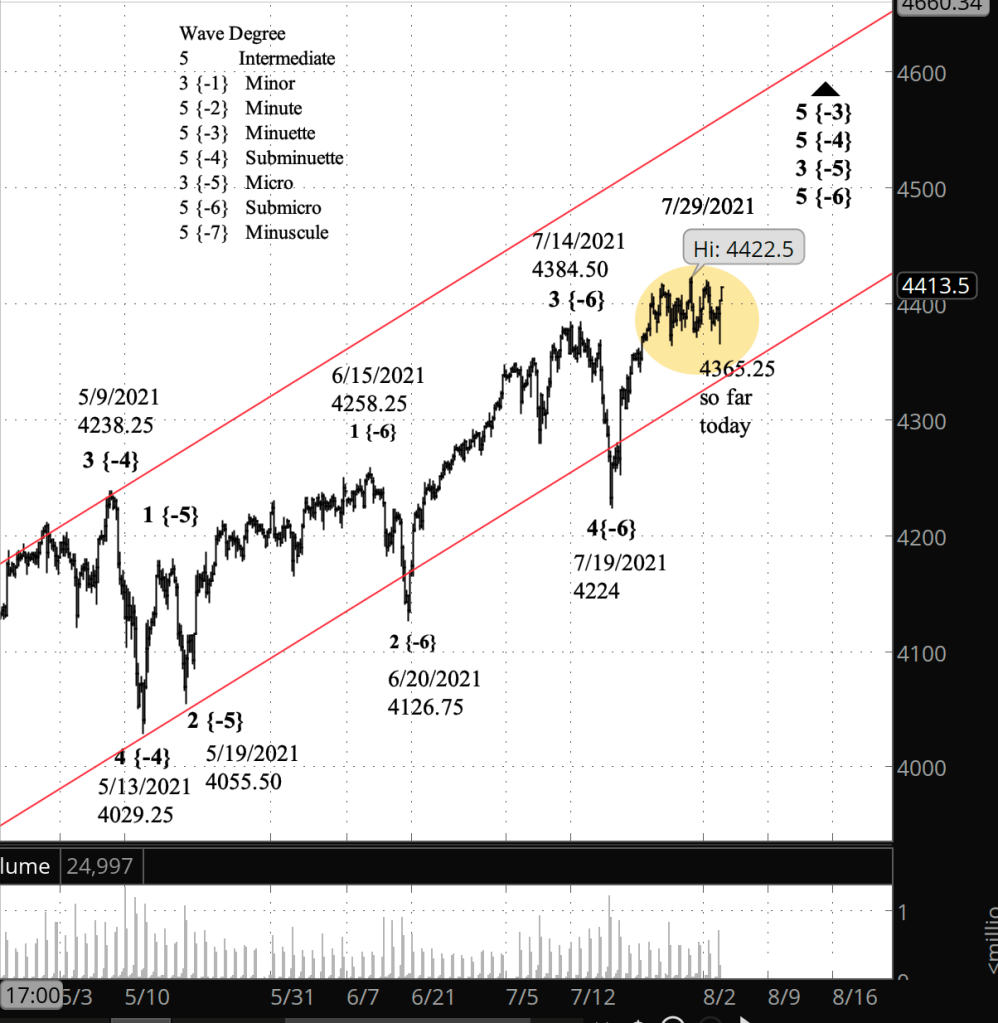
What does Elliott wave theory say? The rise from July 19 is wave 5 of Submicro degree within wave 3 of Micro degree. The end of Submicro 5 will mark the beginning of wave 4 of Micro degree, likely a sideways correction.
The July 29 peak came in the midst of a sideways movement that began a few days earlier (marked on the chart with a yellow oval). Normally, a 5th wave ends with a distinctively directional push in the direction of the trend. This high was a shrug and a muttered, “Meh”. Because of that, I’ve relegated the 5th wave peak theory to my alternative count.
Another problem. The form of the sideways structure that includes the peak is that of a 4th wave, which generally are Flat structures or a series of Flats that are the very picture of indecisiveness. And yet, this is the first significant correction since the uptrend began on July 29 and so should be a 2nd wave internal to the uptrend. It doesn’t break any rules of Elliott wave analysis to have a Flat 2nd wave, but I haven’t seen it very often.
Look as hard as might at the rise from July 19 to July 29, I can’t find a correction of similar proportion. So I’m left with a huge ambiguity that makes it impossible for me to judge the progress within wave 5 of Submicro degree.
Judging from the position of the price within the channel for wave 5 of Minuette degree, the sideways correction must surely be a 2nd wave, because the rise typically will end close to the upper boundary of the channel, about 200 points high as of this moment. So the count within Submicro 5 after the correction should, if it’s typical, have a long 3rd wave, a Zigzag 4th wave correction (under the rule of alternation), and then a 5th wave up to the vicinity of the upper boundary of the channel.
I’ve often said that Elliott wave analysis provides context, not prophecy. Today’s chart is a good illustration of that maxim.
Learning and other resources. See the menu page Analytical Methods for a rundown on where to go for information on Elliott wave analysis.
By Tim Bovee, Portland, Oregon, August 3, 2021
Disclaimer
Tim Bovee, Private Trader tracks the analysis and trades of a private trader for his own accounts. Nothing in this blog constitutes a recommendation to buy or sell stocks, options or any other financial instrument. The only purpose of this blog is to provide education and entertainment.
No trader is ever 100 percent successful in his or her trades. Trading in the stock and option markets is risky and uncertain. Each trader must make trading decisions for his or her own account, and take responsibility for the consequences.
License
All content on Tim Bovee, Private Trader by Timothy K. Bovee is licensed under a Creative Commons Attribution-ShareAlike 4.0 International License.
Based on a work at www.timbovee.com.

You must be logged in to post a comment.