3:30 p.m. New York time
Half an hour before the closing bell. The S&P 500 has barely budged today. No change in the analysis. Chart updated.
My analyses. I analyzed BABA and LVS as potential vertical options spread plays today, but found them lacking for technical reasons. BABA had a greater risk/reward ratio than I’m comfortable with, and LVS has strike prices $5 apart, which made it impossible to fine-tune the trade structure to my liking. I passed on both.
10:10 a.m. New York time
What’s happening now? Overnight, the S&P 500 E-mini futures continued to trade in a narrow range, remaining within the July 29 high of 4422.50 and the August 3 low of 4365.25.
What does it mean? The August 3 low marked the end of a shallow correction and the subsequent rise the first small step in what will eventually become a rise that could reach into the 4500s.
What’s the alternative? The rise after August 3 could be a separator in a complex correction made up of two corrective patterns. Under the alternative, either the sideways movement will continue, or a more directional pattern will begin.
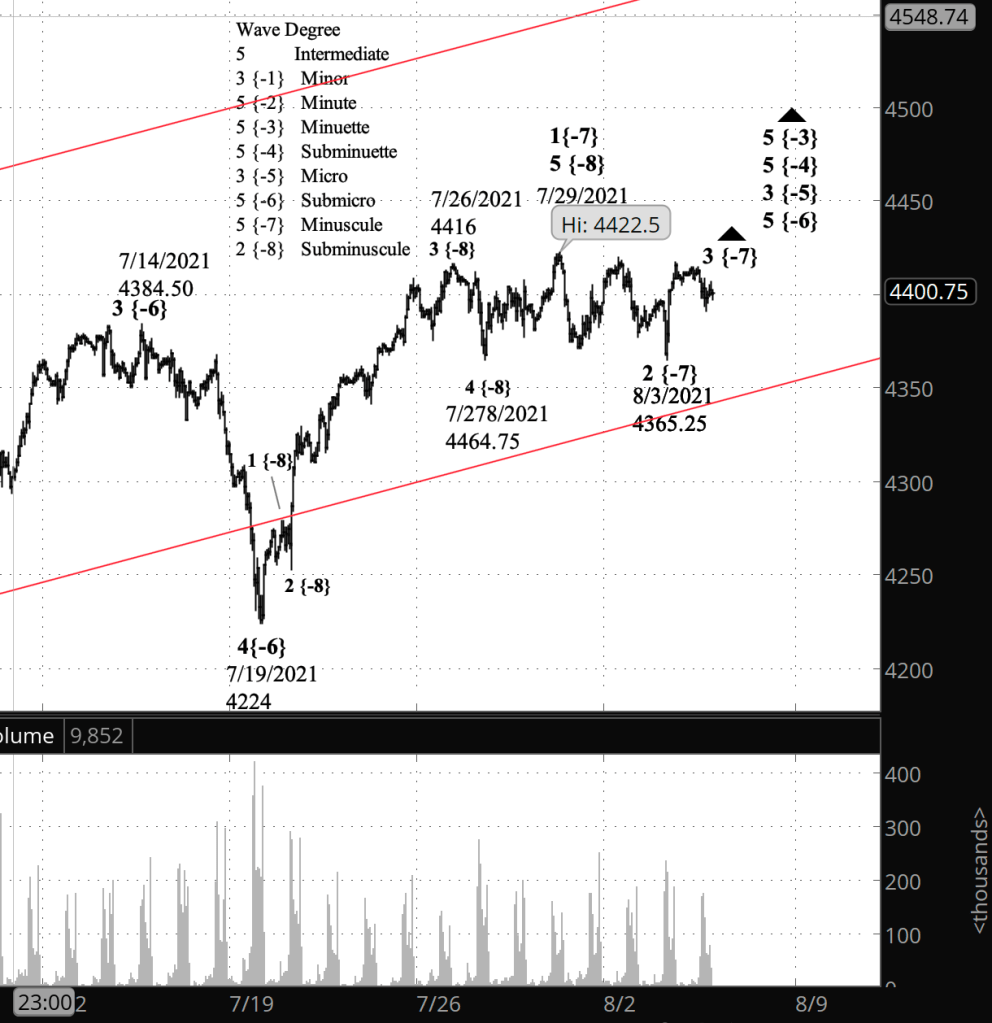
What does Elliott wave theory say? On the chart I’ve made an attempt at labeling the subwaves of wave 5 of Submicro degree, which began on July 19 from 4224. I don’t have a lot confidence in the analysis at Minuscule and Subminuscule degrees. My confidence at the Submicro degree and larger is high.
In detail. The rise from July 19 to July 26 is clear, although it is difficult to make a count that respects the rules of proportionality. The count I’ve done on the chart is in line with the rules of Elliott wave analysis. The subsequent 4th wave of Subminuscule degree is quite clear. The Subminuscule 5th wave that follows has the scribbly quality common in indecisive markets that makes any analysis below Subminuscule problematic.
The July 29 high marking the end of wave 1 of Minuscule degree is clear, although it’s a very short 5th wave at the Subminuscule degree. Under the rules, I couldn’t count the July 29 high as part of a 4th wave correction because it moved above the end of the preceding 3rd wave.
Afterward, wave 2 of Minuscule degree is clearly delineated, but wait: It’s a very unusual wave. Second waves are almost always of the Zigzag pattern and retrace a large proportion of the preceding 1st wave. That’s not what’s happening here. The pattern is a Flat, of the sort typical of 4th waves. It has retraced very little of the 1st wave rise.
As second waves go, this one is very strange.
Under my principle analysis, I’ve counted the August 3 low as the end of wave 2 of Minuscule degree and the subsequent rise as the start of wave 3 of Minuscule degree. However, under the alternative analysis, it’s possible that the low marks the end of the first pattern within a compound wave 2 and the subsequent rise as an X wave separating the first pattern from a second pattern. The second pattern can be another Flat, a Zigzag that will carry the price down further, or a Triangle of some sort.
Time, as always, will tell.
Remember this. Elliott wave analysis provides context, not prophecy. As the 20th century semanticist Alfred Korzybski put it in his book Science and Sanity (1933), “The map is not the territory … The only usefulness of a map depends on similarity of structure between the empirical world and the map.” And I would add, we can judge that similarity of structure only after the fact.
Learning and other resources. See the menu page Analytical Methods for a rundown on where to go for information on Elliott wave analysis
By Tim Bovee, Portland, Oregon, August 4, 2021
Disclaimer
Tim Bovee, Private Trader tracks the analysis and trades of a private trader for his own accounts. Nothing in this blog constitutes a recommendation to buy or sell stocks, options or any other financial instrument. The only purpose of this blog is to provide education and entertainment.
No trader is ever 100 percent successful in his or her trades. Trading in the stock and option markets is risky and uncertain. Each trader must make trading decisions for his or her own account, and take responsibility for the consequences.
License
All content on Tim Bovee, Private Trader by Timothy K. Bovee is licensed under a Creative Commons Attribution-ShareAlike 4.0 International License.
Based on a work at www.timbovee.com.

[…] has done nothing the resolve the question of which analysis is correct. The principle analysis from yesterday’s post: “The August 3 low marked the end of a shallow correction and the subsequent rise the first […]
LikeLike