4:15 p.m. New York time
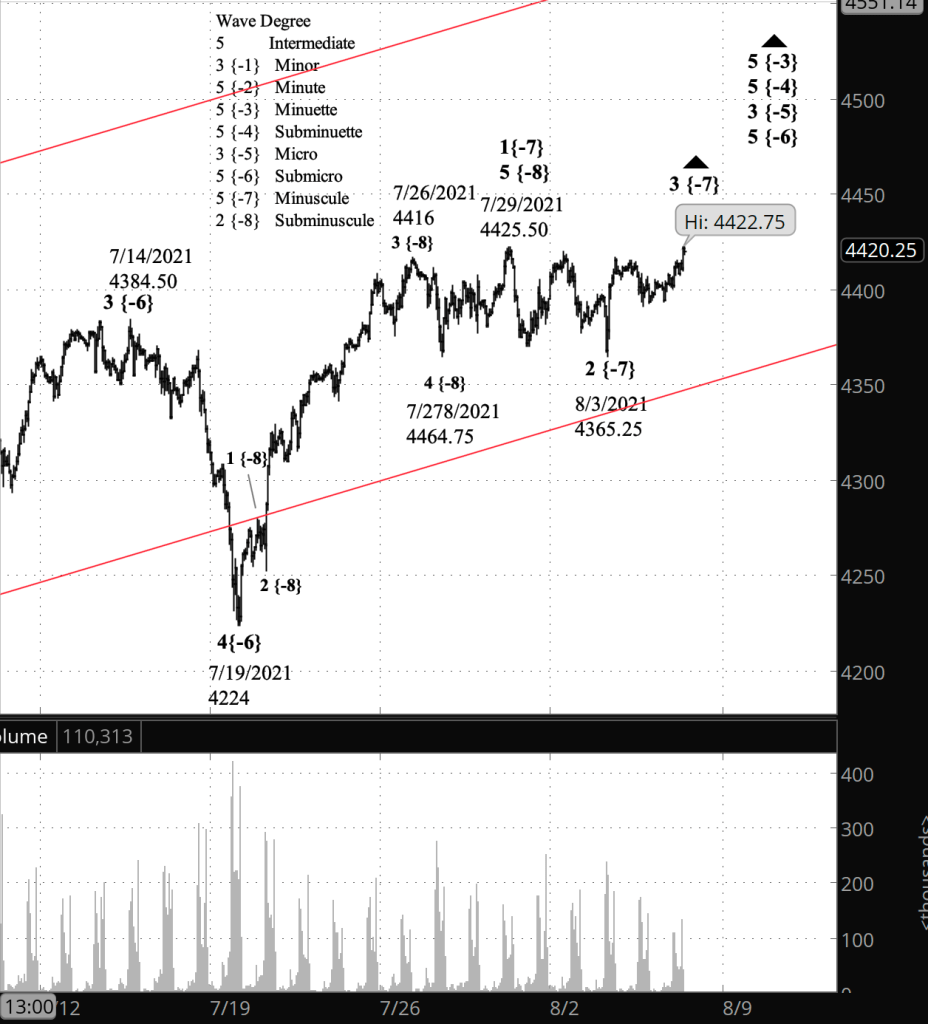
After the closing bell. In last 5 minutes of the trading session, the S&P 500 futures moved above the July 29 high of 4422.50 by a quarter point, to 4422.75. The index, however, stayed 29 points below its July 29 high of 4429.97.
Under the rules of Elliott wave analysis, this creates a divergence in the analyses. The futures, by reaching a higher high, confirmed the principle analysis that sees wave 3 of Minuscule degree on the rise. The index, by failing to reach a new high, gave no such confirmation.
The futures trade in 25-cent increments, so I’m fairly sure that the divergence is a rounding error on the futures side. If the index fails to reach a new high on Friday, then that will create an interesting question: Do I follow the futures and continue to analyze the rise as Minuscule 3? Or do I follow the more precise index and consider the principle analysis for both to not yet be confirmed.
I’ve updated the futures chart again.
3:30 p.m. New York time
Half an hour before the closing bell. The S&P 500 continued to trade within a narrow range, about 15 points on the index and similar on the futures. No change in the analysis. Chart updated.
9:45 a.m. New York time
What’s happening now? The S&P 500 E-mini futures traded sideways for the second night in a row.
What does it mean? The price has done nothing the resolve the question of which analysis is correct. The principle analysis from yesterday’s post: “The August 3 low marked the end of a shallow correction and the subsequent rise the first small step in what will eventually become a rise that could reach into the 4500s.”
What’s the alternative? The alternative analysis from yesterday: “The rise after August 3 could be a separator in a complex correction made up of two corrective patterns. Under the alternative, either the sideways movement will continue, or a more directional pattern will begin.”
What does Elliott wave theory say? Under my principle analysis, the S&P 500 is in a wave 2 downward correction of Subminuscule degree within a rising wave 3 of Minuscule degree within wave 5 of Submicro degree, which in turn is within wave 3 of Micro degree, which began on May 19.
Under the alternative analysis, the corretive wave 2 of Minuscule degree is still underway.
Learning and other resources. Elliott wave analysis provides context, not prophecy. As the 20th century semanticist Alfred Korzybski put it in his book Science and Sanity (1933), “The map is not the territory … The only usefulness of a map depends on similarity of structure between the empirical world and the map.” And I would add, we can judge that similarity of structure only after the fact.
See the menu page Analytical Methods for a rundown on where to go for information on Elliott wave analysis.
By Tim Bovee, Portland, Oregon, August 5, 2021
Disclaimer
Tim Bovee, Private Trader tracks the analysis and trades of a private trader for his own accounts. Nothing in this blog constitutes a recommendation to buy or sell stocks, options or any other financial instrument. The only purpose of this blog is to provide education and entertainment.
No trader is ever 100 percent successful in his or her trades. Trading in the stock and option markets is risky and uncertain. Each trader must make trading decisions for his or her own account, and take responsibility for the consequences.
License
All content on Tim Bovee, Private Trader by Timothy K. Bovee is licensed under a Creative Commons Attribution-ShareAlike 4.0 International License.
Based on a work at www.timbovee.com.

[…] a new high of 4440.82, eliminating the divergence between the futures and the index described in yesterday’s post after the closing […]
LikeLike