3:30 p.m. New York time
Half an hour before the closing bell. After nudging up to a new high, with little enthusiasm, the S&P 500 moved a bit lower. No change to the mid-day analysis. I’ve updated the chart.
12:35 p.m. New York time
Midday update. The S&P 500 rose to new highs today, confirming my principle analysis. The 4th wave correction of Bitsy degree is over, and the parent, wave 3 of Subminuscule degree, has resumed its rise. The alternative analysis is no longer valid. I’ve updated the chart.
9:35 a.m. New York time
What’s happening now? The S&P 500 E-mini futures overnight continued their low-level sideways correction within a higher level uptrend.
What does it mean? The correction will be followed by a resumption of the higher level uptrend within a series of still larger uptrends dating back to May 19 at a price of 4055.50, which I expect to reach the upper boundary of the price channel marked in red on the chart. The channel is presently at around 4590 and will have risen further by the time the uptrend from May is complete.
What’s the alternative? It is possible that the August 6 high of 4433.25 marked the end of the rise that began August 3 from 4365.25. If that’s the case, then the higher level uptrend has moved into a correction. See yesterday’s post for a discussion.
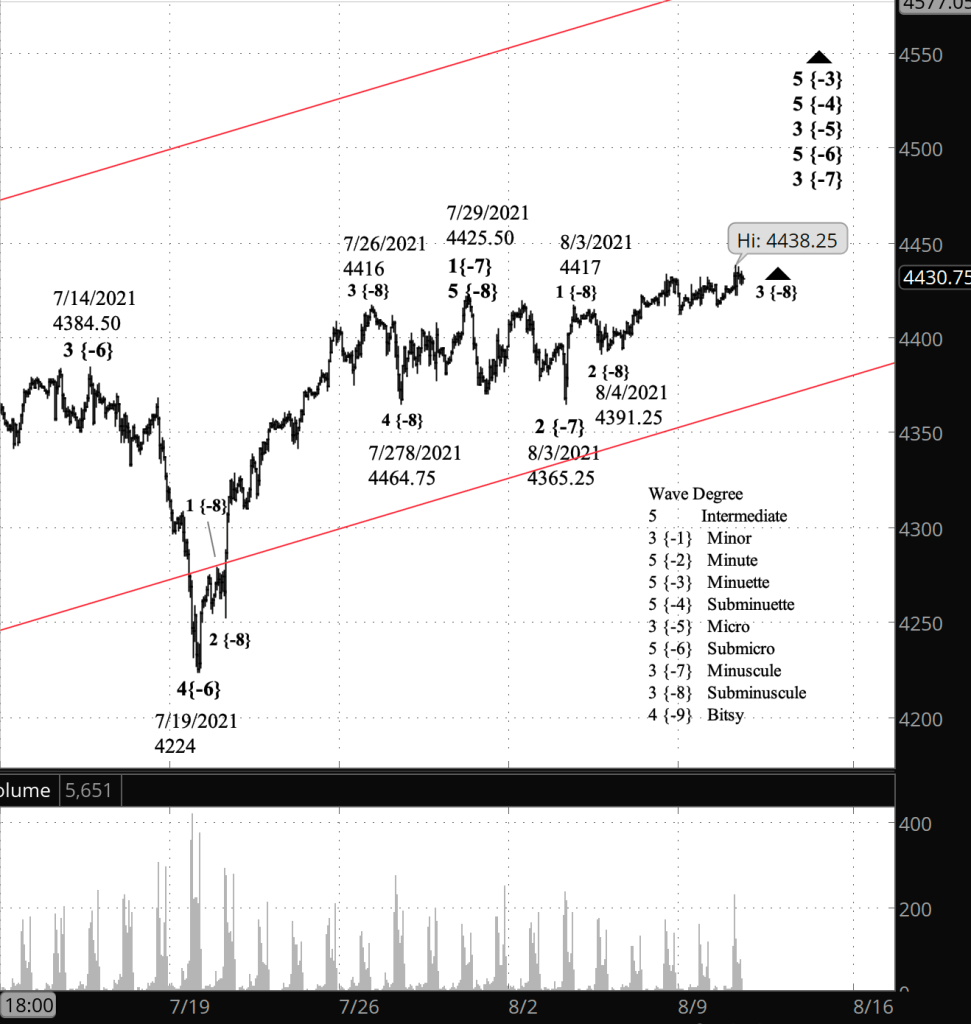
What does Elliott wave theory say? Under my principle analysis, I count the present sideways correction as wave 4 of Bitsy degree within wave 3 of Subminuscule degree. The rise that began on May 19 is wave 3 of Micro degree, up three degrees from Subminuscule.
Under my alternative analysis, the August 6 high of 4433.25 was the end of wave 3 of Subminuscule degree and the present sideways correction is Subminuscule wave 4. Basically, the alternative scenario shifts the count up by one degree. I explained my reasons for considering this to be the less likely analysis in yesterday’s post.
Learning and other resources. Elliott wave analysis provides context, not prophecy. As the 20th century semanticist Alfred Korzybski put it in his book Science and Sanity (1933), “The map is not the territory … The only usefulness of a map depends on similarity of structure between the empirical world and the map.” And I would add, we can judge that similarity of structure only after the fact.
See the menu page Analytical Methods for a rundown on where to go for information on Elliott wave analysis
By Tim Bovee, Portland, Oregon, August 10, 2021
Disclaimer
Tim Bovee, Private Trader tracks the analysis and trades of a private trader for his own accounts. Nothing in this blog constitutes a recommendation to buy or sell stocks, options or any other financial instrument. The only purpose of this blog is to provide education and entertainment.
No trader is ever 100 percent successful in his or her trades. Trading in the stock and option markets is risky and uncertain. Each trader must make trading decisions for his or her own account, and take responsibility for the consequences.
License
All content on Tim Bovee, Private Trader by Timothy K. Bovee is licensed under a Creative Commons Attribution-ShareAlike 4.0 International License.
Based on a work at www.timbovee.com.

You must be logged in to post a comment.